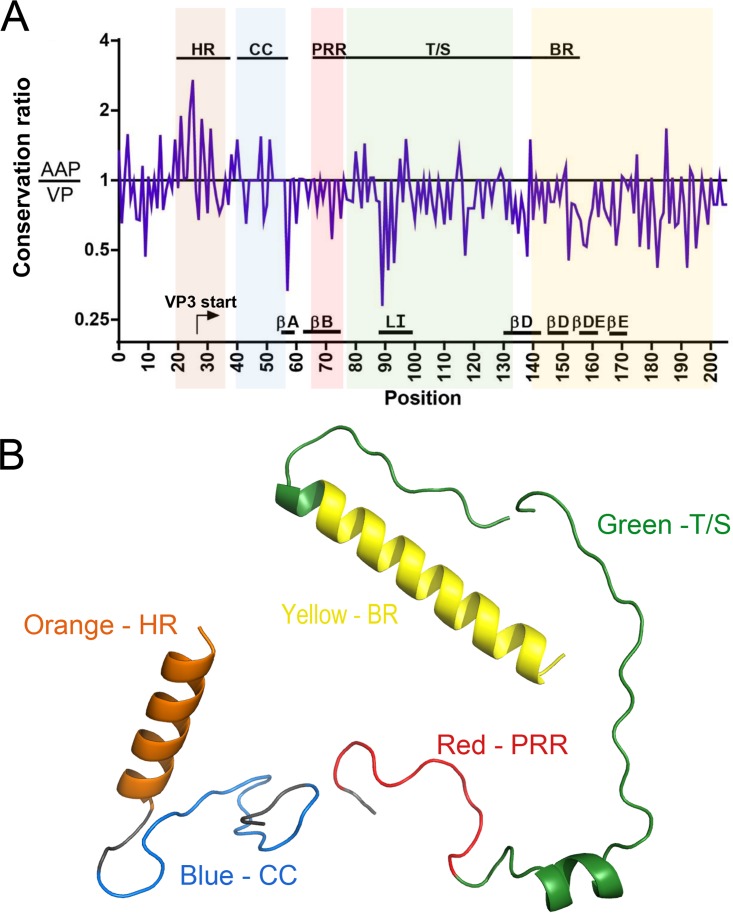
FIG 10.
Bioinformatic analysis of AAP and VP conservation and homology modeling of AAP. A multiple-sequence alignment of AAP and the corresponding VP amino acids was performed and used for further analysis. (A) The ratio of AAP conservation to VP conservation was calculated for each amino acid position and plotted along a positional axis (see Materials and Methods for a detailed bioinformatic analysis). Ratios of >1 indicate greater conservation in AAP and vice versa. Overlaid are various regions and structural elements of each protein. The functional groups in VP are the VP3 start site (arrow), beta-strands A, B, D, and E (βA, βB, βD, and βE), and loop I (LI). Functional regions of AAP are highlighted in different colors: orange (HR), blue (CC), red (PRR), green (T/S), and yellow (BR). (B) Homology modeling of AAP1 (HR and CC), AAP2 (T/S), and AAP4 (BR). Detailed modeling parameters are presented in Materials and Methods.

