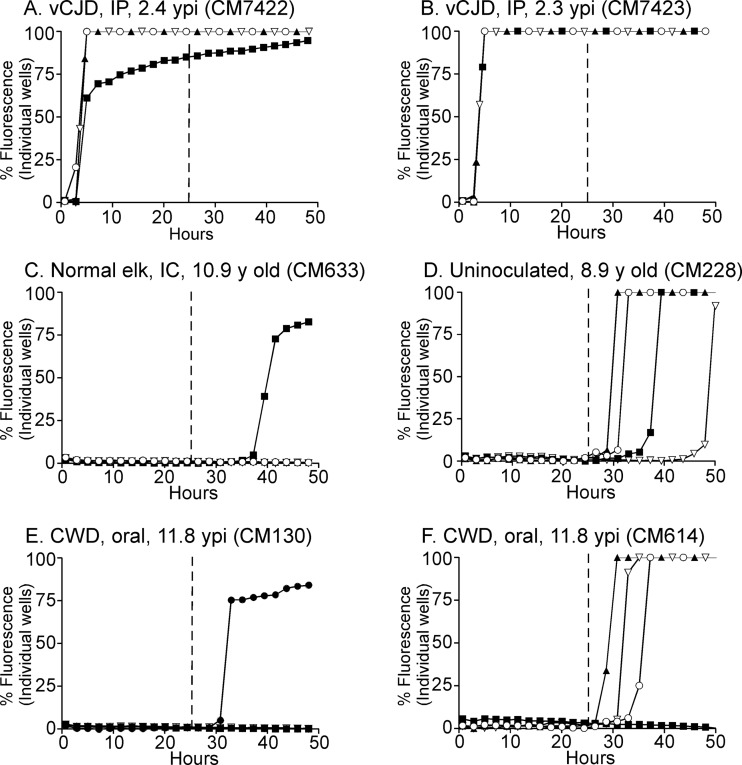
FIG 2.
RT-QuIC analysis of vCJD-inoculated CM, CWD-inoculated CM, and uninoculated CM using the BV rPrPsen substrate. Four independent wells were tested for each CM, and each well is represented as an individual curve shown with one of four different symbols (○, ▲, ■, and ▽) in each panel. All tested brain samples were diluted to 10−3. (A and B) Positive-control vCJD-inoculated CM. (C) Normal elk brain-inoculated CM. (D) Uninoculated CM. (E and F) Two CWD-inoculated CM. The numbers of wells that reacted were variable between individual CM, but no consistent differences were observed between the uninoculated and CWD-inoculated groups. The vertical line shown at 25 h represents the cutoff time to meet the criteria for a positive reaction (see Results and Materials and Methods for more detail). IP, intraperitoneal; ypi, years postinfection; IC, intracerebral.

