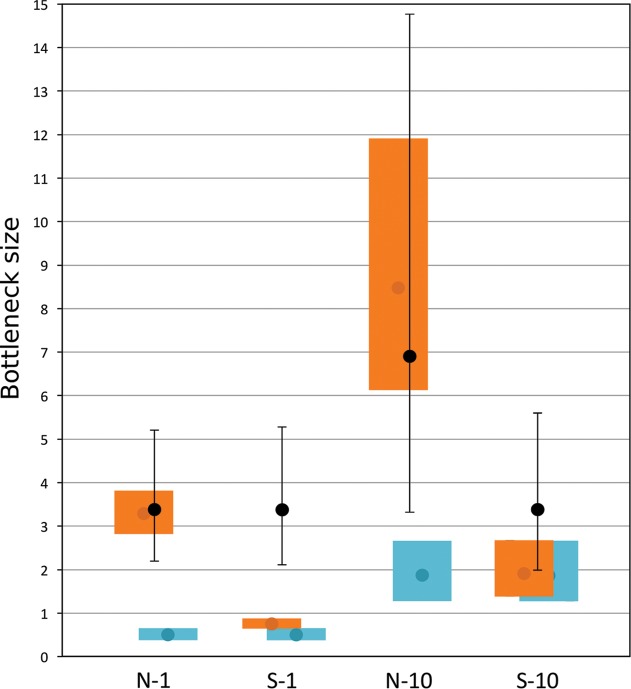
FIG 2.
Estimations of FBNSV bottleneck sizes with two approaches. Black dots show the effective population sizes (Ne) estimated from variations in the relative frequency of marked N and S segments after transmission with 1 or 10 aphids (values shown in Table 1). Error bars correspond to the 95% credibility intervals of these estimates. Colored rectangles show the mean (dot) and 95% confidence intervals of bottleneck size predictions based on transmission rates under the random (orange) and packing (blue) hypotheses.

