
FIG 3.
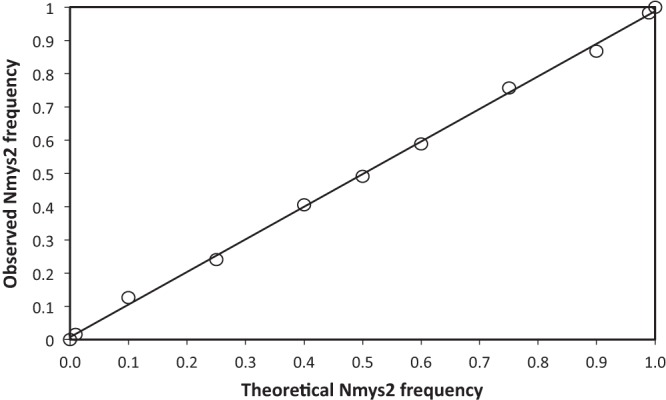
Example of theoretical versus observed relative frequencies of the Nmys2 segment obtained with the relative frequency control scale. This plot confronts the theoretical relative frequencies of the plitmus28 Nmys2 plasmid in the control scale N, with relative frequency estimations from qPCR performed on the control scale samples. The regression formula is the following: y = 0.9807x + 0.0072. R2 = 0.9988.