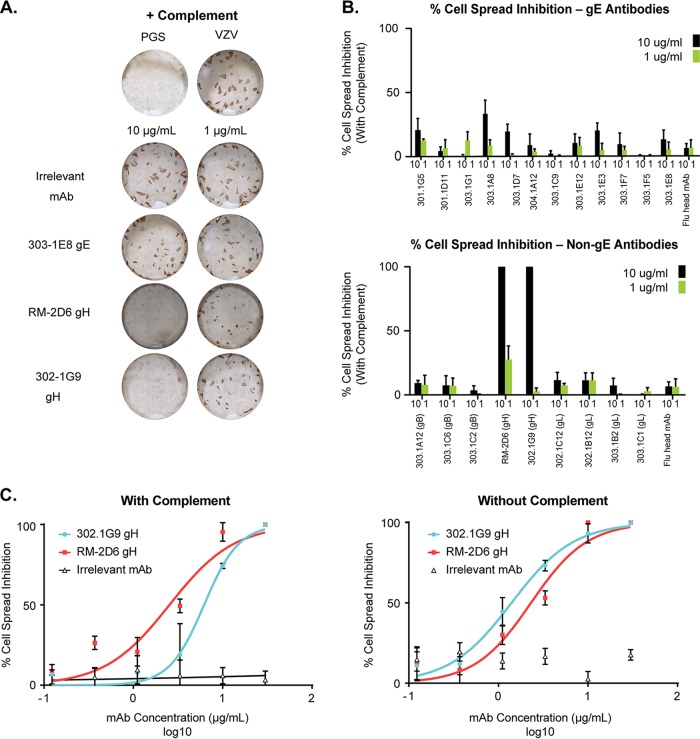
FIG 7.
In vitro cell-to-cell spread inhibition. Cell-to-cell spread inhibition was performed as described in Materials and Methods. (A) Representative well images for samples treated with complement. PGS buffer was used as a negative control. (B) Cumulative data for anti-gE antibodies (top) and non-gE antibodies (bottom). Black bars represent antibodies added at 10 μg/ml, and green bars represent the same antibodies added at 1 μg/ml. (C) Cell spread inhibition curves with IC50 values (μg/ml) with anti-gH or irrelevant MAbs, with (left) or without (right) complement added.

