FIG 5.
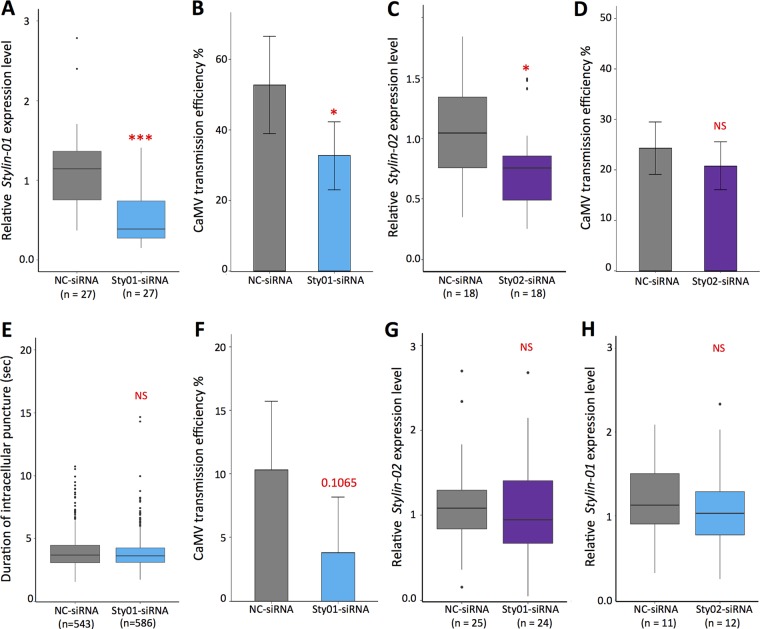
Effects of stylin-01 and stylin-02 gene silencing on cauliflower mosaic virus transmission. (A) Box plots represent median (horizontal line) and 25th and 75th percentiles of transcript levels of stylin-01 normalized against two reference genes, the actin and EF1α genes. The stylin-01 relative expression level is significantly reduced in sty01-siRNA-treated Myzus persicae compared to the NC-siRNA group (ANOVA, n = 27 pools of 10 aphids each, P = 8.12 × 10⁻⁶). (B) Proportion of CaMV-infected plants calculated from two independent experiments (means ± SDs). For each experiment and for each treatment, two aphids were transferred onto each test plant (n = 48) after a 5-min acquisition access period (AAP). The asterisk indicates significant differences between virus transmission efficiencies (chi-square test, P = 0.016). (C) Box plots represent stylin-02 transcript levels normalized against two reference genes, as in panel A. The stylin-02 relative expression level is significantly reduced (ANOVA, n = 18 pools of 10 aphids, P = 0.0231). (D) Proportion of CaMV-infected plants calculated from three independent experiments (means ± SDs). For each experiment and for each treatment, as for panel B, we used two aphids per test plant (n = 72). No significant difference was observed between virus transmission efficiencies (chi-square test, P = 0.473). (E) Boxes showing the interquartile and the median represent the mean duration of intracellular punctures (pds) produced on CaMV-infected turnip plants by M. persicae fed for 72 h on NC-siRNA (n = 543) or sty01-siRNA (n = 582). No significant difference was observed between the two treatments (ANOVA, P = 0.574). (F) Proportion of CaMV-infected plants calculated from five independent experiments (means ± SDs). For each experiment repeat and each treatment, a single aphid was transferred per test plant (n = 22) after an AAP of 5 pds. The P value (chi-square test) reflecting a marginally significant difference between the two treatments is indicated on the graph. Black circles in panels A, C, and E are outliers. (G and H) Controls demonstrate that Sty01-siRNA and Sty02-siRNA do not silence stylin-02 (G) and stylin-01 (H), respectively. The specificity of silencing of Sty01-siRNA was estimated from 25 and 24 pools (for NC-siRNA and Sty01-siRNA, respectively) out of the 27 pools used for panel A and from 11 and 12 pools (for NC-siRNA and Sty02-siRNA, respectively) out of the 18 pools used for panel C. Asterisks in panels A and C indicate differences as follows: ***, P < 0.001, and *, P < 0.05. NS, not significant.

