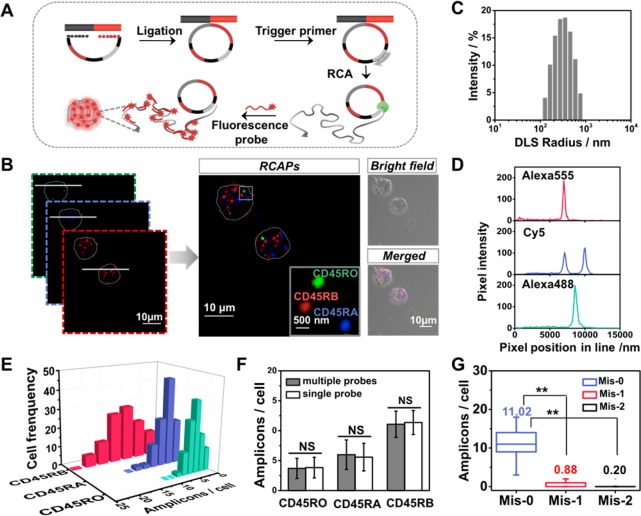
Figure 1.
Simultaneous imaging of CD45 splicing variants in single Jurkat T cells. (A) Schematic diagram of SpliceRCA for detection of CD45 RNA isoforms using in situ RCA. (B) Fluorescent image of CD45RO, CD45RA, and CD45RB isoforms visualized by SpliceRCA in Jurkat T cells. Inset: the fluorescent image of the boxed subregion with colored labels indicating potential mRNA isoforms. The outline of the Jurkat T cell is marked with a gray dot line. Scale bars: 10 μm (overview images) and 500 nm (insets). (C) Dynamic light scattering (DLS) analysis for RCA amplicons. (D) Intensity plots of the lines in panel B show that mRNA spot signals are distinguished from background. (E) Frequency histogram of amplicons of three splicing isoforms in single cells (cell number >100). (F) Comparison of SpliceRCA results in simultaneous detection with separate detection (n > 100; NS, not significant). (G) Quantification of the average numbers of CD45RB amplicons detected in Jurkat cells by using Mis-0, Mis-1, and Mis-2 splice-junction anchored padlock probes (n > 100; **P < 0.001).

