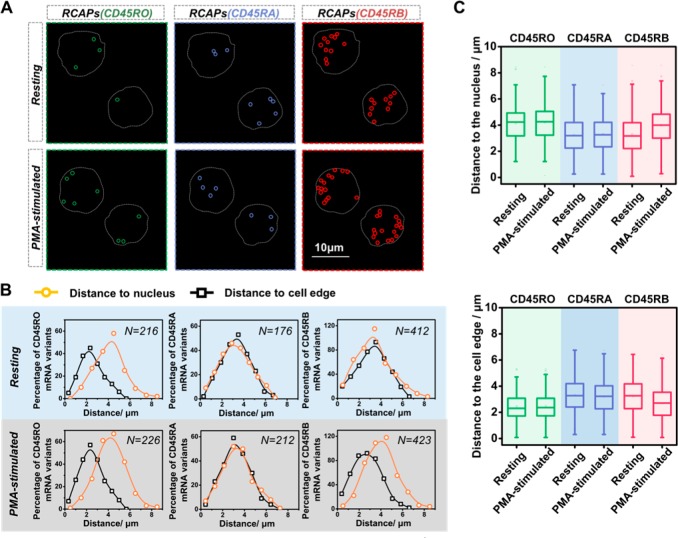
Figure 3.
Mapping the spatial distribution of CD45 isoforms in the Jurkat T cells. (A) Example images of the spatial distributions observed for CD45 isoforms before and after PMA stimulation. The RCA amplicons of CD45RO, CD45RA, and CD45RB are marked with green, blue, and red circles, respectively, and the outlines of cell are marked by a gray dotted line. Scale bars: 10 μm. (B) Single-cell profiles for distance to cell nucleus (yellow dots) and the edge (black dots). N is the number of cell dots per plot. (C) Quantification of average distances for three CD45 isoforms to the cell nucleus or the edge before and after PMA stimulation.

