
Figure 6.
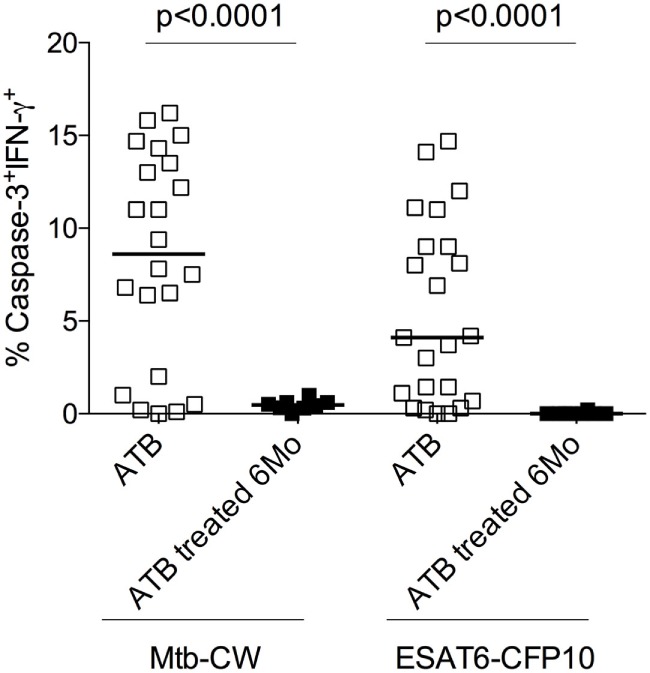
Frequencies of caspase-3+ Mycobacterium tuberculosis (Mtb)-specific CD4+ T cells at baseline and 6 months after anti-TB treatment. Analysis of the frequencies of caspase-3+IFN-γ+CD4+ T cells in individuals with treatment-naive active tuberculosis (ATB) (n = 23) as well as those who received 6 months of anti-TB treatment (ATB treated 6 months; n = 8). Mann–Whitney U test was used to compare the two groups. A P-value of less than 0.05 was considered to be statistically significant. Bars represent means.