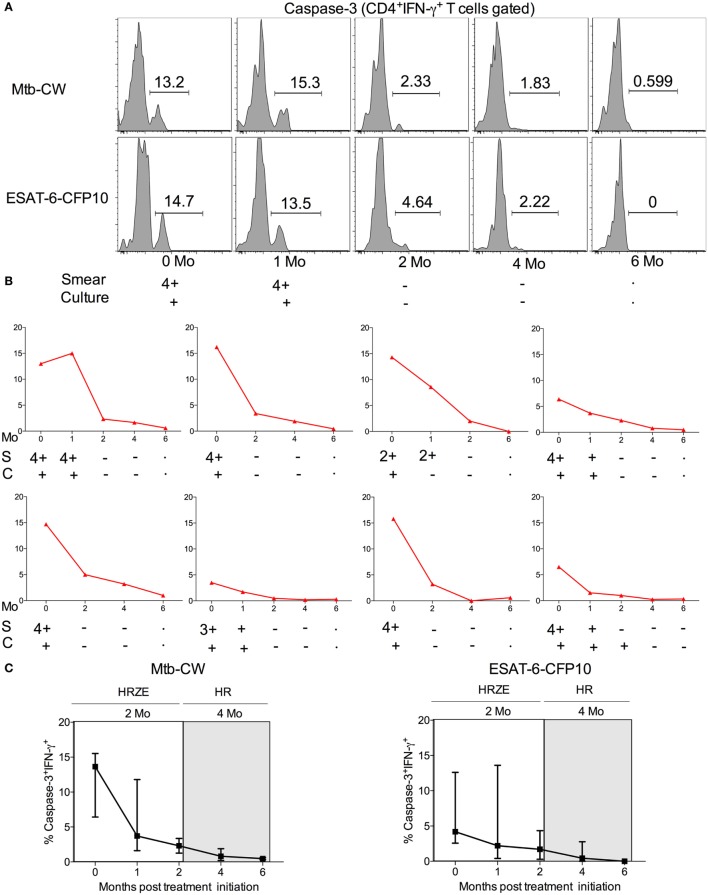
Figure 7.
Comparison of the frequencies of caspase-3+IFN-γ+CD4+ T cells in 7 TB patients undergoing the 6-month regimen of anti-TB treatment. (A) Representative flow plots for one patient, (B) frequencies of caspase-3+IFN-γ+CD4+ T cells in eight different ATB patients over the course of anti-TB treatment after stimulation with Mtb-CW, and (C) cumulative data for eight patients are shown for the frequencies of caspase-3+IFN-γ+ T cells. The 2-month intensive phase (HRZE) and 4-month continuation phase (HR) are indicated. Abbreviations: S = sputum smear, C = culture.

