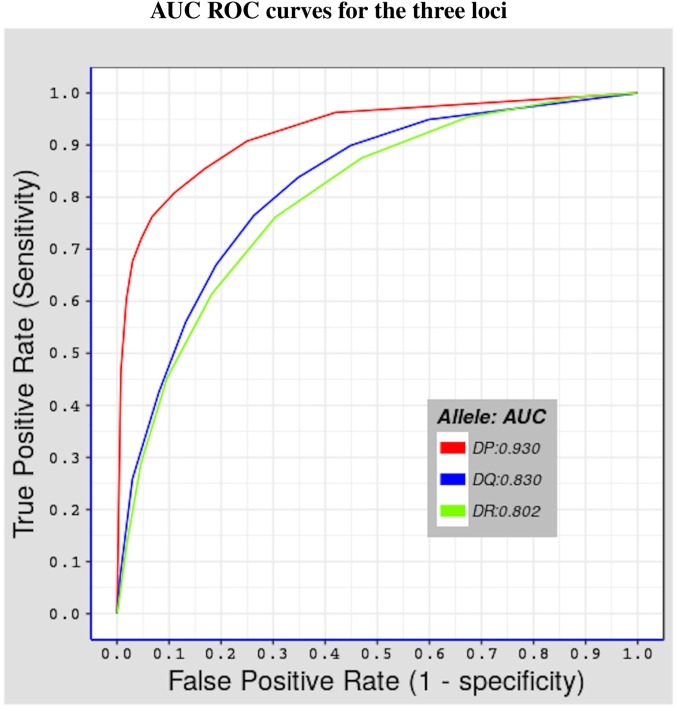
Figure 1.
Shows fivefold cross validation results of the model using the benchmark dataset described in Section 2.3. Three ROC curves representing the three MHC-II loci covered in this study. The red curve for HLA-DP with AUC value = 0.930, the blue curve for HLA-DQ with AUC value = 0.830, and the green curve for HLA-DR with AUC = 0.802.

