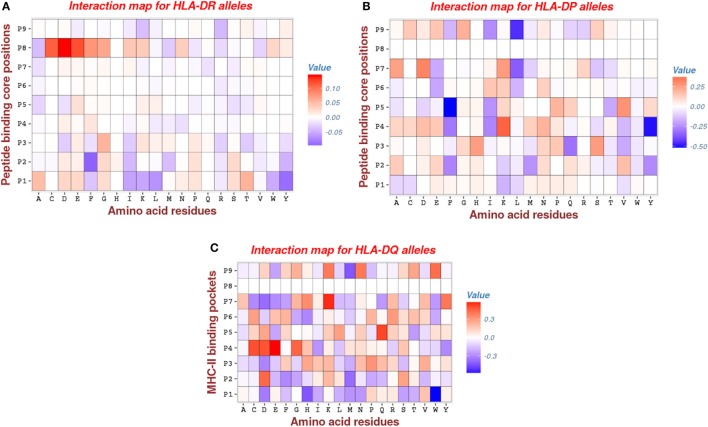
Figure 5.
Interaction maps for: (A) HLA-DR, (B) HLA-DP, and (C) HLA-DQ molecules. The rows give the 9 anchor positions of MHC-II binding groove and the columns give the peptide residues. The red entries marking for repulsive interactions (positive energy), whereas the blue entries marking for attractive interactions (negative energy). Note that most of the entries are zeros (white color), an indication for the degree of the sparsity of the model.

