Figure 1.

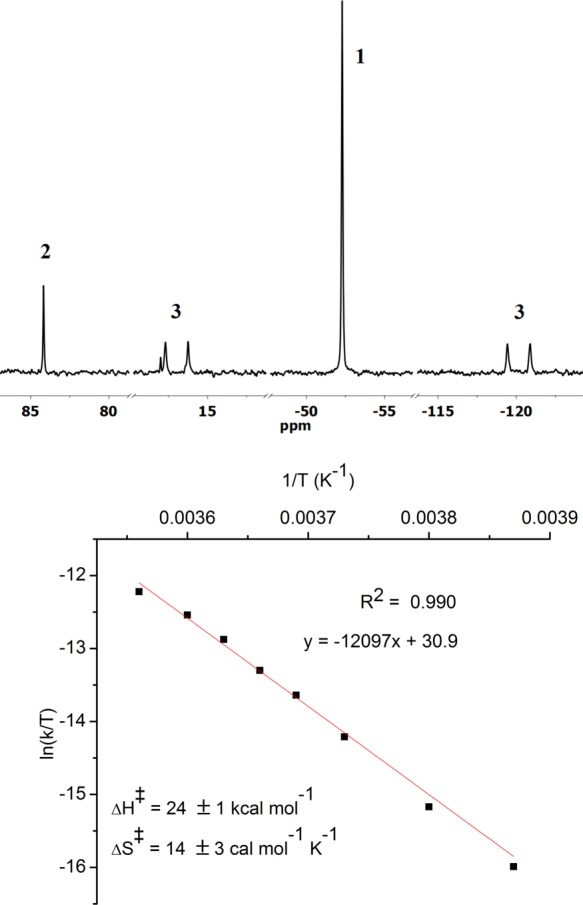
(top) 31P{1H} NMR spectrum during reduction of 1 at −30 °C under N2. (bottom) Eyring plot for the conversion of 3 to 2 in the temperature range −15 to +7.5 °C.

(top) 31P{1H} NMR spectrum during reduction of 1 at −30 °C under N2. (bottom) Eyring plot for the conversion of 3 to 2 in the temperature range −15 to +7.5 °C.