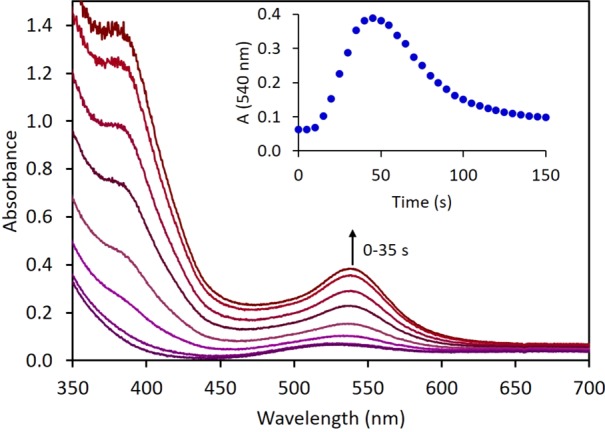
Figure 3.

UV–vis spectroelectrochemistry (SEC) electrolysis of 1, showing the absorption profile during conversion of 1 to intermediate 3. (inset) Time course tracking absorbance at 540 nm for formation and decay of 3. Conditions: 2 mM 1, 0.2 M [nBu4N][PF6] in THF at 25 °C, −1.45 V vs Ag wire pseudoreference constant applied potential over 10 min, Au working and counter electrodes, Ag wire pseudoreference electrode in a “honeycomb” cell arrangement.
