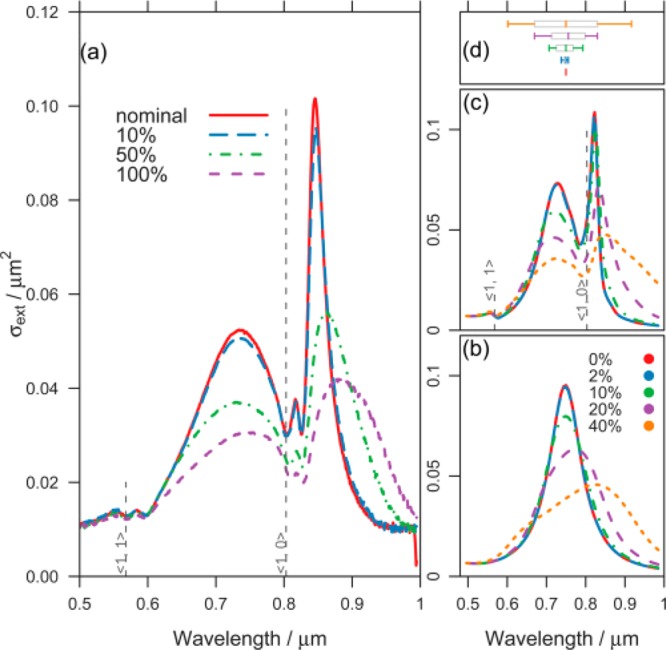
Figure 11.

Effect of size disorder on SLRs. (a) Measured extinction spectra from arrays of nanoparticles that have regular positions but that have a variation in particle size. The legend shown indicates the level of disorder in the length of the nanorods’ long-axis. Vertical lines (dashed) mark the ⟨1,0⟩ and ⟨1,1⟩ diffraction edges for the 550 nm periodic array for a homogeneous environment of refractive index equal to 1.46. The nominal sizes of the particles were 120 nm × 80 nm × 35 nm. (b) Calculated extinction spectra based on five distributions of 441 ellipsoids. (c) Calculated extinction spectra for a regular array of dipoles (pitch 550 nm) based on the distribution of individual LSPR frequencies that are shown in (d). Reproduced and adapted with permission from ref (102). Copyright 2009 The Optical Society.
