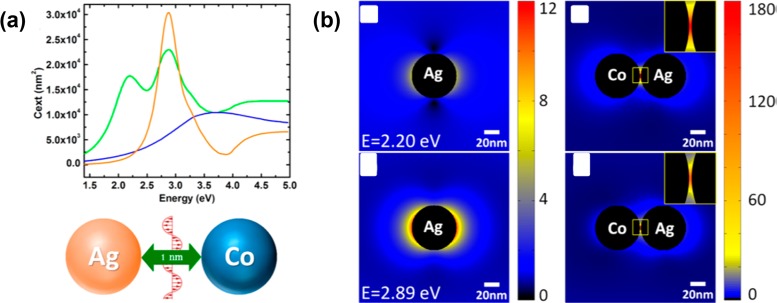
Figure 27.
(a) Comparison between the extinction spectra of a single 60 nm diameter spherical Ag NP (orange line), a 60 nm spherical Co NP (blue line), and the extinction spectra of a dimer (green line) formed by the interaction of these two NPs separated by a 1 nm gap as illustrated in the schematic below. The dimer exhibits two peaks, one at 2.20 and the other at 2.89 eV; the first is at a much lower energy than the peaks associated with the isolated Co NP and Ag NP, and the second is also lower in energy than the Co NP but at almost the same energy of the isolated Ag NP. (b) Electromagnetic field enhancement (E/E0) distribution around the nanoparticle dimer at the two peak energies produced by the interaction of a plasmonic NP and a nonoplasmonic ferromagnetic Co NP shown in panel A. The insets in the figure show higher resolution views of the field enhancement around the NP dimer marked by the squares. Figure reproduced with permission from ref (282). Copyright 2014 American Chemical Society.

