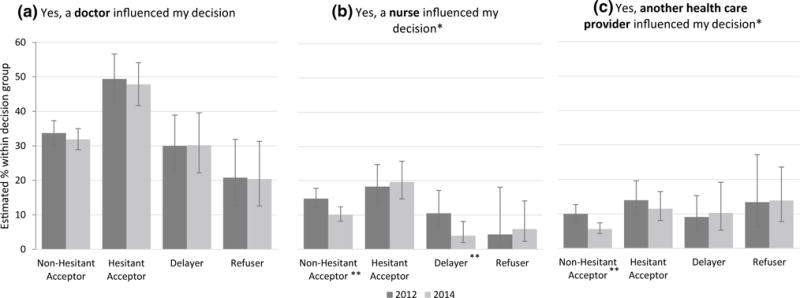
Fig. 2.

Healthcare provider influence on decision about vaccination by non-influenza vaccine decision and by survey year. Participants were asked the following questions: Did a a doctor, b a nurse, c another healthcare provider influence your decision about vaccinating your youngest child? Error bars indicate 95% CI of the point estimate for each decision group. Non-hesitant acceptor (2012: N = 1761, 2014: N = 1748), hesitant acceptor (2012: N = 493, 2014: N = 465), delayer (2012: N = 191, 2014: N = 171), refuser (2012: N = 147, 2014: N = 112). *Overall distribution of rates among vaccine decision groups is significantly different between survey years with p < 0.05.
**Rate within this vaccine decision group is significantly different between survey years with p < 0.01
