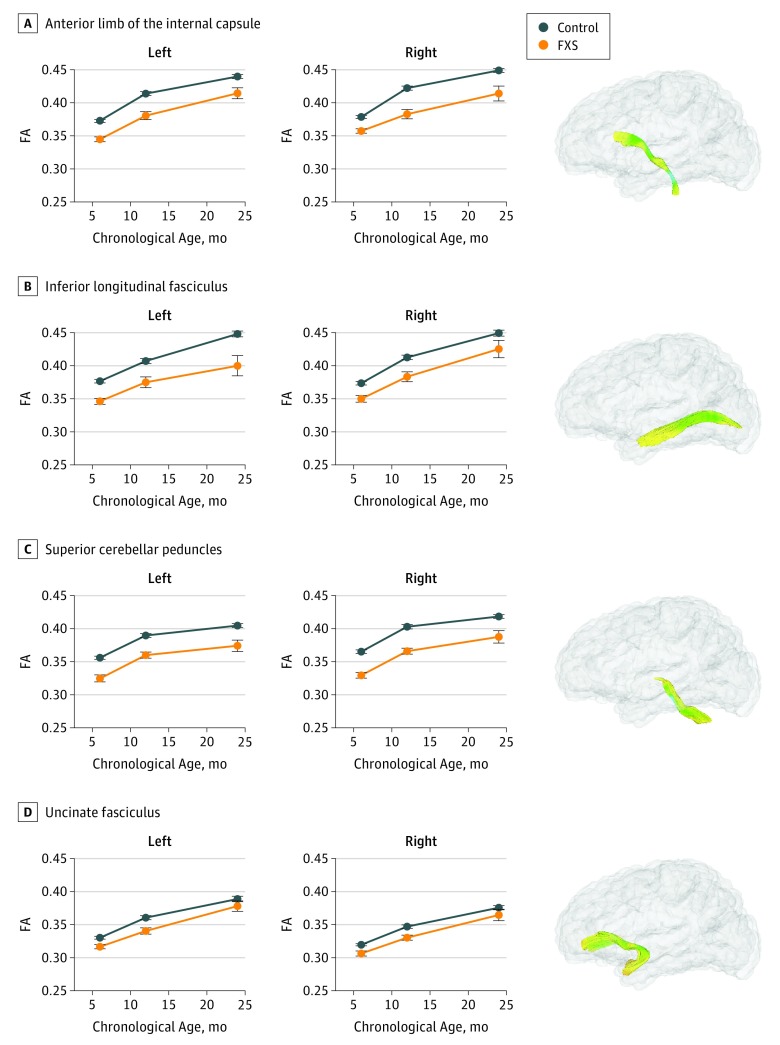
Figure 1. Fractional Anisotropy (FA) Values in Infants With Fragile X Syndrome (FXS).
A, Infants with FXS have lower FA values than controls in the bilateral anterior limb of the internal capsule (left: percentage difference, –6.25%; q = .002; right: percentage difference, –6.69%; q = .02). B, Infants with FXS have lower FA values than controls in the inferior longitudinal fasciculi (left: percentage difference, –7.44%; q = .001; right: percentage difference, –5.14%; q = .001). C, Infants with FXS have lower FA values than controls in the superior cerebellar peduncles (left: percentage difference, –6.91%; q = .002; right: percentage difference, –7.92%; q = .001). D, Infants with FXS have lower FA values than controls in the uncinate fasciculi (left: percentage difference, –3.84%; q = .005; right: percentage difference, –3.45%; q = .008). Error bars = ±1 SEM. q Values are false discovery rate–corrected P values for the group main effect. Percentage decrease compares least squares means in FA across all time points in patients with FXS compared with controls.

