

Abstract
Transcriptional regulation mediated by the zinc finger protein Snail1 controls early embryogenesis. By binding to the epithelial tumor suppressor CDH1 gene, Snail1 initiates the epithelial–mesenchymal transition (EMT). The EMT generates stem‐like cells and promotes invasiveness during cancer progression. Accordingly, Snail1 mRNA and protein is abundantly expressed in triple‐negative breast cancers with enhanced metastatic potential and phenotypic signs of the EMT. Such high endogenous Snail1 protein levels permit quantitative chromatin immunoprecipitation‐sequencing (ChIP‐seq) analysis. Snail1 associated with 185 genes at cis regulatory regions in the Hs578T triple‐negative breast cancer cell model. These genes include morphogenetic regulators and signaling components that control polarized differentiation. Using the CRISPR/Cas9 system in Hs578T cells, a double deletion of 10 bp each was engineered into the first exon and into the second exon–intron junction of Snail1, suppressing Snail1 expression and causing misregulation of several hundred genes. Specific attention to regulators of chromatin organization provides a possible link to new phenotypes uncovered by the Snail1 loss‐of‐function mutation. On the other hand, genetic inactivation of Snail1 was not sufficient to establish a full epithelial transition to these tumor cells. Thus, Snail1 contributes to the malignant phenotype of breast cancer cells via diverse new mechanisms.
Keywords: bone morphogenetic protein, breast cancer, chromatin immunoprecipitation, epithelial–mesenchymal transition, transforming growth factor β
Abbreviations
- BMP
bone morphogenetic protein
- ChIP
chromatin immunoprecipitation
- CPED1
cadherin‐like and PC‐esterase domain containing 1
- CRB1
Crumbs 1
- ECM
extracellular matrix
- EMT
epithelial–mesenchymal transition
- EMT‐TF
EMT transcription factor
- MET
mesenchymal–epithelial transition
- PPFIA1
protein phosphatase regulatory factor interacting protein α 1
- TGFβ
transforming growth factor β
- ZEB
zinc finger E‐box binding homeobox 1
1. Introduction
During cancer progression, metastasis is a process that contributes to the mortality of cancer patients (Lambert et al., 2017; Nguyen et al., 2009). A hallmark of metastasis is the ability of tumor cells to invade their microenvironment (Lambert et al., 2017; Nguyen et al., 2009). Associated with the invasion cascade are processes of cell differentiation and de‐differentiation, which in the case of epithelial carcinomas are best known as epithelial–mesenchymal transition (EMT) and mesenchymal–epithelial transition (MET) (Nieto et al., 2016; Ye and Weinberg, 2015). As such differentiation changes can be reversible or often take place via successive and intermediate stages, they are also frequently described with the term epithelial plasticity (Nieto et al., 2016; Ye and Weinberg, 2015). EMT is driven by developmental transcription factors (EMT‐TFs) that control the expression of several genes, often classified into two broad functional groups: the epithelial genes, whose expression is repressed by the EMT‐TFs, and the mesenchymal genes, whose expression is induced by the EMT‐TFs (Nieto et al., 2016; Ye and Weinberg, 2015). A common net result observed at the cellular level after an EMT is the loss of cell–cell contacts and the remodeling of extracellular matrix (ECM) and cytoskeletal and cell membrane–ECM adhesion assemblies (Nieto et al., 2016).
A prototype EMT‐TF is Snail1/SNAI1, a member of the Snail/Scratch family of zinc finger (ZF) transcription factors, which together with Snail2/SNAI2/Slug play important roles in mediating the EMT during embryonic development and cancer progression (Barrallo‐Gimeno and Nieto, 2009; Baulida and Garcia de Herreros, 2015). Snail1 expression in epithelial cells induces the EMT (Batlle et al., 2000; Cano et al., 2000). In breast cancer, high Snail1 expression correlates with high‐grade malignancy, characterized by reduced degree of differentiation, a higher level of invasiveness and metastatic potential (Blanco et al., 2002). Accordingly, engineered expression of low‐level Snail1 in mice causes malignancy, suggesting that the action of Snail1 takes place at early stages of cancer progression (Perez‐Mancera et al., 2005). Conversely, genetic silencing of Snail1 expression in carcinomas causes MET and suppresses invasiveness (Olmeda et al., 2007). Snail1 can also be expressed in mesenchymal cells, such as cancer‐associated fibroblasts (CAFs), and thus drive the plasticity of the adjacent carcinoma cells (Baulida and Garcia de Herreros, 2015). In colon cancer CAFs, Snail1 controls the expression of mesenchymal cytoskeletal proteins and secretion of chemokines that coordinately promote the invasiveness of the tumor cells (Herrera et al., 2014). In a similar mechanistic scenario, Snail1 expression and induction of EMT also contributes to organ fibrosis as is the case of renal disease; Snail1 expression promotes renal EMT and generation of myofibroblasts with contractile features similar to those of CAFs, whereas suppression of Snail1 reverts the fibrotic phenotype in experimental mice where Snail1 expression can be switched on and off (Grande et al., 2015).
Snail1 is a well‐characterized transcriptional repressor, which upon direct binding to E‐box sequences (5′‐CANNTG‐3′) on gene regulatory elements, such as the promoter of the E‐cadherin/CDH1 gene, blocks expression of E‐cadherin, a key epithelial cell–cell contact protein, thus mediating in part the detachment between differentiated epithelial cells, a hallmark of the EMT (Batlle et al., 2000; Cano et al., 2000). Upon binding to DNA, Snail1 forms complexes with corepressor complexes containing the histone deacetylases HDAC1/2, the histone H3 methyltransferases G9a and Suv39H1 and DNA methyltransferases, all enforcing transcriptional shut off, repressive chromatin conformation and even DNA methylation at the target gene, such as CDH1, during breast cancer EMT (Dong et al., 2012, 2013a; Peinado et al., 2004). In addition to CDH1, Snail1 can transcriptionally repress other epithelial genes, including the ECM gene MUC1, the tight junctional gene CLAUDIN1 and the epithelial polarity gene CRUMBS3 (Guaita et al., 2002; Martinez‐Estrada et al., 2006; Whiteman et al., 2008). Furthermore, Snail1 arrests the epithelial cell cycle and promotes survival, by repressing the expression of pro‐apoptotic genes (Vega et al., 2004), whereas transcriptional repression of the fructose‐1,6‐bisphosphatase (FBP1) gene switches on glycolytic rates and contributes to the survival of breast cancer cells that undergo the EMT (Dong et al., 2013b), thus linking EMT to the generation of stem‐like features in cancer cells (Ye and Weinberg, 2015). Snail1 positively regulates the expression of other EMT‐TFs, such as the ZF and homeobox transcription factor ZEB1, whose transcription is induced by a complex between Snail1 and Twist1 during breast cancer EMT in response to transforming growth factor β (TGFβ) (Dave et al., 2011; Guaita et al., 2002).
The transcriptional activity of Snail1 can be regulated by post‐translational modifications, including phosphorylation. Glycogen synthase kinase‐3β (GSK‐3β) controls Snail1 levels via three distinct mechanisms: By inactivating the transcription factor NF‐κB, GSK‐3β inhibits Snail1 gene transcription (Bachelder et al., 2005); by phosphorylating Snail1 directly, GSK‐3β causes nuclear export of Snail1 (Zhou et al., 2004); and by phosphorylating a separate amino acid residue in Snail1, GSK‐3β recruits the ubiquitination machinery that causes degradation of cytoplasmic Snail1 (Zhou et al., 2004). Accordingly, the activity of GSK‐3β on Snail1 in the nucleus is counterbalanced by the small C‐terminal phosphatase that dephosphorylates and stabilizes nuclear Snail1, thus enhancing its transcriptional activity (Wu et al., 2009). Simultaneously, phosphorylation of nuclear Snail1 by the Lats2 protein kinase inhibits the nuclear export of Snail1 and prolongs Snail1 protein stability and transcriptional activity during the EMT (Zhang et al., 2012). Nuclear Snail1 also becomes poly‐ADP‐ribosylated by interacting with the chromatin‐bound enzyme poly‐ADP‐ribose polymerase 1 (PARP‐1), which also prolongs the stability and nuclear residence of Snail1, thus contributing to breast cancer EMT and invasiveness (Rodriguez et al., 2011). Beyond post‐translational enzymatic modifications, Snail1 protein expression is regulated at the translational level by the action of microRNA‐34 (miR‐34) (Siemens et al., 2011). MiR‐34 represses Snail1 protein synthesis, and miR‐34 expression is induced by the pro‐epithelial tumor suppressor protein p53, whereas Snail1 itself represses miR‐34 expression, thus enforcing a shutdown of its own repressor (Siemens et al., 2011).
Whereas miR‐34 downregulates Snail1 expression, the best‐studied transcriptional inducer of Snail1 expression, and of EMT, in a variety of carcinomas is the TGFβ signaling pathway (Barrallo‐Gimeno and Nieto, 2009; Moustakas and Heldin, 2012). This pathway is mediated by the plasma membrane receptors of TGFβ, being serine/threonine kinases, exhibiting weak tyrosine kinase activity; these receptors phosphorylate cytoplasmic Smad proteins and other adaptor proteins that control the activity of lipid and protein kinases, coordinately leading to the regulation of target genes, such as Snail1 (Moustakas and Heldin, 2012). In this respect, TGFβ signaling promotes the EMT, favors carcinoma invasiveness, arrests the proliferation of immune cells, and induces pro‐angiogenic factors, thus collectively enhancing metastatic potential (Bierie and Moses, 2006). Snail1 thus becomes a pivotal mediator of TGFβ actions in cancer and also controls the expression of TGFβ ligands. The mechanism by which TGFβ induces Snail1 transcription during EMT involves protein kinase signaling and Smad complexes with high mobility group A2 (HMGA2), c‐Myc, or STAT3, the latter being activated by oncogenic Ras signaling that cooperates with TGFβ during EMT induction (Peinado et al., 2003; Saitoh et al., 2016; Smith et al., 2009; Thuault et al., 2008). Furthermore, when Snail1 acts on target genes, such as CDH1, it cooperates with transcriptional complexes between Smads and β‐catenin/LEF‐1 (Medici et al., 2006; Vincent et al., 2009). Snail1 also feeds back to TGFβ signaling, as it can maintain the expression of the type II receptor of TGFβ in breast cancer and is required for the responsiveness of mesenchymal stem cells to TGFβ (Batlle et al., 2013; Dhasarathy et al., 2011).
Despite our deep understanding of Snail1 function and its contribution to the EMT and cancer progression, current knowledge regarding target genes of Snail remains somewhat limited. Specific key examples have been summarized above. For this reason, we analyzed the genomewide association of Snail1 in breast carcinomas and evaluated phenotypic adaptations to the loss of function mutation in Snail1 in the same tumor cells.
2. Material and methods
2.1. Cell culture
Breast cancer Hs578T and MDA‐MB‐231 cells and human embryonic kidney HEK‐293T cells were cultured in Dulbecco's modified Eagle's medium (DMEM) and breast cancer T47D cells in Roswell Park Memorial Institute (RPMI)‐1640 supplemented with 10% fetal bovine serum in the presence of penicillin and streptomycin. The cells were starved for 18 h in serum‐free DMEM or RPMI, followed by stimulation with TGFβ1 (5 ng/ml).
2.2. CRISPR/Cas9 knockout models
Hs578T cells were transfected with CRISPR/Cas9 and HDR plasmids targeting Snail1, obtained from Santa Cruz Biotech Inc. (Santa Cruz, CA, USA). Two days post‐transfection, cells were selected with puromycin and single cell colonies were selected and cultured. Knockout clones were then validated using immunoblotting and the mutated DNA sequences were analyzed using conventional PCR and DNA sequencing.
2.3. Transient transfection
HEK‐293T cells were seeded at a density of 5 × 10⁵ cells in 100‐mm culture dishes, and transient overexpression was performed with the indicated plasmids (final total DNA of 5 μg). Cells were transfected at approximately 80% confluency using Fugene HD (Promega Corp., Stockholm, Sweden) as transfection reagent, according to the manufacturer's guidelines. Transfection was performed for 48 h. The plasmids used were pCDNA3 as mock control and pcDNA3‐HA‐Snail1, which we have previously described (Vincent et al., 2009).
2.4. T‐Scratch assay
Cells were seeded in a six‐well plate such that they were 90% confluent the following day. A simple ‘+’ scratch was made in the cell layer using a filtered 10‐μL pipet tip. Cells were washed with PBS twice and left in DMEM. The scratched area was then observed, and pictures were obtained using a phase contrast microscope. The culture was left at 37 °C overnight and then observed under the same microscope and photographed. Both observations on day 1 and day 2 were analyzed using the t‐scratch software https://github.com/cselab/TScratch to quantify the migration of the cells. Each experiment was performed three times, and each condition included triplicates.
2.5. Immunoblotting and antibodies
Total cellular proteins were extracted in nonidet P‐40 (NP‐40)‐containing lysis buffer, 20 mm Tris/HCl, pH 8.0, 1% NP‐40, 150 mm NaCl, 2 mm EDTA, and complete protease inhibitor cocktail (Roche Diagnostics Scandinavia AB, Bromma, Sweden). Lysates were heated at 95 °C for 5 min and subjected to SDS/PAGE. The following antibodies were used: rabbit polyclonal anti‐Slug antibody (Santa Cruz Biotech Inc.); rabbit monoclonal anti‐Snail1 antibody (Cell Signaling, Leiden, the Netherlands); rabbit polyclonal anti‐ZEB1 antibody (Novus Biologicals, R&D Systems Europe, Abingdon, UK); rabbit control IgG‐ChIP grade, mouse control IgG‐ChIP grade and rabbit monoclonal anti‐BMP6 antibody (Abcam, Cambridge, UK); monoclonal mouse anti‐β‐actin antibody (Santa Cruz Biotech. Inc.); mouse polyclonal anti‐N‐cadherin (Becton Dickinson AB, Stockholm, Sweden); rabbit monoclonal anti‐fibronectin (Sigma‐Aldrich AB, Stockholm, Sweden); rabbit polyclonal anti‐coxsackie and adenovirus receptor (anti‐CAR; a gift of Jonas Fuxe, Karolinska Institute, Sweden); rabbit polyclonal anti‐HSP95 (home‐made); and rabbit polyclonal anti‐CPED1 antibody (Thermo Fisher Scientific, Stockholm, Sweden).
2.6. DNA affinity precipitation (DNAP)
HEK‐293T cells transfected with pcDNA3‐HA‐Snail1 were lysed in 0.5% NP‐40, 100 mm EDTA, and 100 mm Tris/HCl, pH 8.0. Lysates were precleared with streptavidin beads for 30 min and incubated for 90 min with biotin‐labeled double‐stranded oligonucleotides. Streptavidin beads were then added for 30 min followed by three washes with lysis buffer and dissolved into sample buffer containing 1% SDS and 1 mm DTT. DNA‐bound proteins were subjected to SDS/PAGE followed by immunoblotting. The DNA sequences represented in the biotinylated oligonucleotides were obtained from the Snail1‐binding motif information as described in the Section 4; they represent sequences centering on peaks defined by the ChIP analysis and map in each corresponding human gene body as shown in the figures. The oligonucleotide sequences were as follows: hsCPED1, forward, 5′‐biotin‐GTCCGCAAATGCACATCAGGCTTCACCAGCTAATGAGGACAAATGAGGTC‐3′; reverse, 5′‐GACCTCATTTGTCCTCATTAGCTGGTGAAGCCTGATGTGCATTTGCGGAC‐3. HsBMP6, forward, 5′‐biotin‐GATACCACTTGGCCAATCCATGACAAGGTCCATGAACAAATGGCCTTG‐3′; reverse, 5′‐CAA GGCCATTTGTTCATGGACCTTGTCATGGATTG GCCAAGTGGTATC‐3′. HsCRB1, forward, 5′‐biotin‐GACCCACCAGATGACTCTGGGCACACAGAATAATTG‐3′; reverse, 5′‐CAATTATTCTGTGTGCCCAGAGTCATCTGGTGGGTC‐3′. HsPPF1A1, forward, 5′‐biotin‐CTATATTCTGTTGTTGGGTGGTGTGTTCTATG‐3′; reverse, 5′‐CATAGAACACACCACCCAACAACAGAATATAG‐3′. HsPPF1Amut, forward, 5′‐biotin‐CTATATTCTATTATTAGGTAGTATATTTCTATG‐3′; reverse, 5′‐CATAGAAATATACTACCTAATAATAGAATATAG‐3′. HsCDH1‐A, forward, 5′‐biotin‐GGGGCTCACCTGGCTGCAG CCAC‐3′; reverse, 5′‐GTGGCTGCAGCCAGGTGAGCCCC‐3′. HsCDH1‐B, forward, 5′‐biotin‐GGCCGGCAGGTGAACCCTCAGCC‐3′; reverse, 5′‐GGCTGAGGGTTCACCTGCCGGCC‐3′.
2.7. Chromatin immunoprecipitation
Cells were cultured and then fixed in 2% formaldehyde for 10 min at 37 °C. Immediately, formaldehyde was removed and cells were washed in ice‐cold PBS twice. Cells were scraped in PBS and spun down at 4000 rpm for 5 min. The supernatant was removed, and cells were lysed in SDS lysis buffer (1% SDS, 10 mm EDTA, 50 mm Tris, pH 8.1, with added protease inhibitors) for 20 min on ice. Lysed cells were then sonicated to obtain an average DNA fragment size of 250 bp. Input chromatin of about 10% was aliquoted and frozen at −20 °C. The remaining lysate was then diluted 10 times in ChIP dilution buffer (0.01% SDS, 1.0% Triton X‐100, 1.2 mm EDTA, 16.7 mm Tris/HCl pH 8.1, 167 mm NaCl, supplemented with protease inhibitors) and subjected to immunoprecipitation using the Snail1 antibody described above or control rabbit antiserum, overnight at 4 °C. Protein‐A dynabeads were added to the lysate, and incubation was prolonged for 2 h at 4 °C. Beads were then washed once in low salt buffer (0.1% SDS, 1% Triton X‐100, 2 mm EDTA, 20 mm Tris/HCl, pH 8.1, 150 mm NaCl), once in high salt buffer (0.1% SDS, 1% Triton X‐100, 2 mm EDTA, 20 mm Tris/HCl pH 8.1, 500 mm NaCl), once in lithium chloride wash buffer (0.25 M LiCl, 1% IGEPAL, 1% deoxycholic acid, 1 mm EDTA, 10 mm Tris/HCl, pH 8.1), and then twice in TE buffer (10 mm Tris/HCl, pH 8.0, 1 mm EDTA). After the series of washing steps, beads and input samples were resuspended in elution buffer (1% SDS, 0.1% of 1 m NaHCO3) and mixed up and down for 30 min and left for de‐crosslinking in the presence of NaCl at 65 °C overnight. The chromatin was then subjected to proteinase‐K digestion followed by phenol–chloroform extraction. Respective input was used to normalize the DNA in each sample that was subjected to chromatin immunoprecipitation. The extracted DNA was then subjected to either PCR quantification or sequencing experiment. ChIP‐seq results were validated using ChIP‐qPCR with specific primers for the human CDH1 promoter, forward 5′‐GGCCCTGCAGTTCCTTGGCT‐3′, reverse 5′‐AGTGAGCAGCGCAGAGGCTG‐3′; human BMP6 promoter, forward 5′‐GCTCTCACTTGGGGTTCACTA‐3′, reverse 5′‐CAC CCAATGGAACTTCAAGGC‐3′; human PPFIA1, forward 5′‐TGTCTGTGATGGTCCTGTAGG‐3′, reverse 5′‐ CTGTACAGGACCCCACT‐3′; human CRB1, forward 5′‐CCTGACCTCGTGATCCAACT‐3′, reverse 5′‐GTCAAGAATGTGCACTCCTCA‐3′; human CPED1, forward 5′‐ TTAGAGGCCAGATAACCTGCAC‐3′, reverse 5′‐GAGGTTTCCAACCTTGCCGA‐3′.
2.8. DNA library preparation and sequencing protocols
ChIP DNA was obtained with four biological and technical replicates and pooled for sequencing. The quality of the ChIP DNA obtained was analyzed with a Bioanalyzer. The DNA obtained from input, and ChIP was sheared with sonication using the Covaris S2 instrument (Covaris, Inc., Brighton, UK). ChIP‐seq libraries were constructed from the sheared samples using the AB Library Builder System (Life Technologies, Stockholm, Sweden), followed by amplification and wildfire conversion according to the manufacturer's protocols. Sequencing was performed at 75 bp read length on the SOLiD 5500W system (Life Technologies). Library preparation was performed using the library kit (5500 SOLiD Library Builder Fragment Core Kit + 5500W Conversion Primer Kit), after which sequencing was performed using a sequencing instrument (SOLiD 5500W) at sequencing unit SOLiD5500W FlowChip. Raw sequences were aligned to the human genome hg19 using maximum stringency, and unique sequences were retained in the .BAM file format. Raw sequences were aligned to the human genome hg19 using Life Technologies/Thermo Fisher lifescope (version 2.1) (Stockholm, Sweden) with default settings retaining only uniquely mapped reads.
2.9. Real‐time RT‐PCR
RNA was extracted from both Hs578T wild‐type and Snail1 knockout clones using the TRIzol reagent protocol (Ambion, Life Technologies). Complementary DNA (cDNA) was synthesized using the iScript cDNA synthesis kit from Bio‐Rad (Bio‐Rad Laboratories AB, Nacka, Sweden). Real‐time PCR was carried out using iTaq SYBR green supermix with ROX from Kappa (Techtum, Nacka, Sweden) using denaturation temperature 95 °C for 30 s, annealing temperature 56 °C for 30 s, and amplification temperature 72 °C for 45 s, repeating this protocol 39 times; a melting curve was plotted using 0.5 °C raise for every 5 s from 65 °C to 95 °C. The primers used for quantitative PCR amplification were as follows: human HPRT1 forward 5′‐ GCTTCCTCCTCCTGAGCAGTC‐3′ and reverse 5′‐CACTAATCACGACGCCAGGGCTGC‐3′; human PPFIA1 forward 5′‐GGTGTTCACGGAGCACTTCT‐3′ and reverse 5′‐CCTTCTATCAGTCCCCATGACCAA‐3′; CRB1 forward 5′‐GCCTCTGATCCGTGTG TCA‐3′ and reverse 5′‐ACTGAGCCAATAGTGGTGAAAATGT‐3′; BMP6 forward 5′‐GGACATGGTCATGAGCTTTGTGAA‐3′ and reverse 5′‐CAGTCCTTGTAGATGCGGAATTCT‐3′; and CPED1 forward 5′‐CCCCACAACTGCCAATATGGT‐3′ and reverse 5′‐CTGCCATTCCTGCAACGTTT‐3′.
2.10. AmpliSeq transcriptome human gene expression
RNA for AmpliSeq was extracted with three biological replicates and three technical replicates. Total RNA (50 ng) was reverse‐transcribed to cDNA using Ion AmpliSeq™Transcriptome Human Gene Expression Kit Preparation Protocol (Revision A.0; Life Technologies). The acquired cDNA was amplified using Ion AmpliSeq™ Transcriptome Human Gene Expression core panel (Life Technologies), and the primer sequences were then partially digested. Then, adaptors (Ion P1 Adapter and Ion Xpress™ Barcode Adapter, Life Technologies) were ligated to the amplicons. Adaptor‐ligated amplicons were purified using Agencourt® AMPure® XP reagent (Beckman Coulter AB, Bromma, Sweden) and eluted in amplification mix (Platinum® PCR SuperMix High Fidelity and Library Amplification Primer Mix, Life Technologies) and amplified. Size selection and purification were conducted using Agencourt® AMPure® XP reagent (Beckman Coulter AB). The amplicons were quantified using the Fragment Analyzer™ instrument (Advanced Analytical Technologies, Inc., Ankeny, IA, USA) with DNF‐474 High Sensitivity NGS Fragment Analysis Kit (Advanced Analytical Technologies, Inc.). Samples were then pooled (six or less per pool), followed by emulsion PCR on either the Ion OneTouch™ 2 System using the Ion PI™ Hi‐Q™ OT2 Kit (Life Technologies), or on the Ion Chef™ System using the Ion PI Hi‐Q Chef Kit (Life Technologies). The pooled samples were loaded on Ion PI™ v3 chips and sequenced on the Ion Proton™ System using the Ion PI™ Hi‐Q Sequencing 200 Kit chemistry (200 bp read length, Life Technologies). Acquired reads were aligned to the hg19 AmpliSeq Transcriptome ERCC v1 using the Torrent Mapping and Alignment Program (tmap) with default settings. Differentially expressed genes were called requiring a mean log2‐fold change over the replicates of two and a q‐value < 0.05 (one‐sided t‐test with false discovery rate adjustment).
2.11. Bioinformatic analysis methods
2.11.1. Transcriptomic analysis in the GOBO database
The gene expression data sets for SNAI1 and SNAI2 in human breast cancer cells were obtained by utilizing the cell line module of the Web‐based tool gene expression‐based Outcome for Breast cancer Online (GOBO) (Ringner et al., 2011). Data were obtained using default settings and protocols prescribed by the authors.
2.11.2. ChIP‐seq analysis
Aligned reads were filtered on mapping quality using samtools (Li et al., 2009) with ‘–q 20’. Peaks were called from ChIPs with the input as background using macs software (version 1.4.2) (Zhang et al., 2008) with the following changes to default settings: ‘–nomodel –shiftsize=125 –keep‐dup=1’. Identified peaks were annotated to the closest gene using BEDTools (Quinlan and Hall, 2010) and protein coding genes from the refseq databases (hg19). FASTA sequence (Human Genome version GRCh37.57) ± 125 bp from the center of each peak summit as predicted by MACS was extracted, and enriched DNA motifs were identified using TOMTOM motif identification suit (Bailey et al., 2009). Data were obtained using default settings and prescribed protocols by the authors.
2.11.3. Visualization of peaks
ChIP‐seq peaks were uploaded into the UCSC genome browser (Kent et al., 2002) using custom bigWig tracks and overlayed using publicly available H3K27AC data.
2.11.4. Gene ontology
Differentially expressed genes and binding targets of Snail1 were classified into the groups of molecular, biological, and cellular components using the gene ontology (GO) Panther online tool (Mi et al., 2013). Genes were grouped into functional groups using default settings and protocols.
3. Data accessibility
All ChIP‐seq and AmpliSeq transcriptomic data have been deposited to Array Express under Accession Numbers E‐MTAB‐5242 and E‐MTAB‐5244, respectively.
4. Results
4.1. Mesenchymal Hs578T breast cancer cells express high levels of Snail1
Snail1 can be highly expressed in human breast cancers, which correlates with the grade of malignancy, de‐differentiation, and metastatic dissemination (Blanco et al., 2002). Using an independent breast cancer mRNA expression database, GOBO (Ringner et al., 2011), we confirmed that Snail1 mRNA expression scored highly in diverse human breast cancer cell lines, including basal‐B (highest expression), some basal‐A (intermediate expression), and fewer luminal epithelial (lowest expression) breast cancer cells (Fig. 1A). Confirming variability in cancer patient expression profiles, not all basal‐B cells exhibited robust mRNA levels for Snail1 (Fig. 1A). We also examined expression of the sibling EMT‐TF, Snail2 in the same cohort of breast cancer cells, and also observed high Snail2 mRNA expression in the basal‐B subgroup of human breast cancer cells (Fig. 1A). Similar data can be obtained from transcriptomic analyses of breast cancer tissue (data not shown); however, in such whole tumor tissue databases, it is not clear whether the specific expression profile represents the carcinoma cells or various stromal cells in the tumor microenvironment. For this reason, we limited our database analysis to isolated carcinoma cell lines that have been cultured in vitro and, based on their clonality, are known to be free of associated tumor stromal cells. Overall, the strong level of expression and a significant correlation between Snail1 and Snail2 expression in human breast cancer cells of the basal‐B subgroup are consistent with previous findings, and agree with the EMT‐like phenotype of basal‐B breast cancer cells (Hennessy et al., 2009; Shipitsin et al., 2007; Taube et al., 2010).
Figure 1.
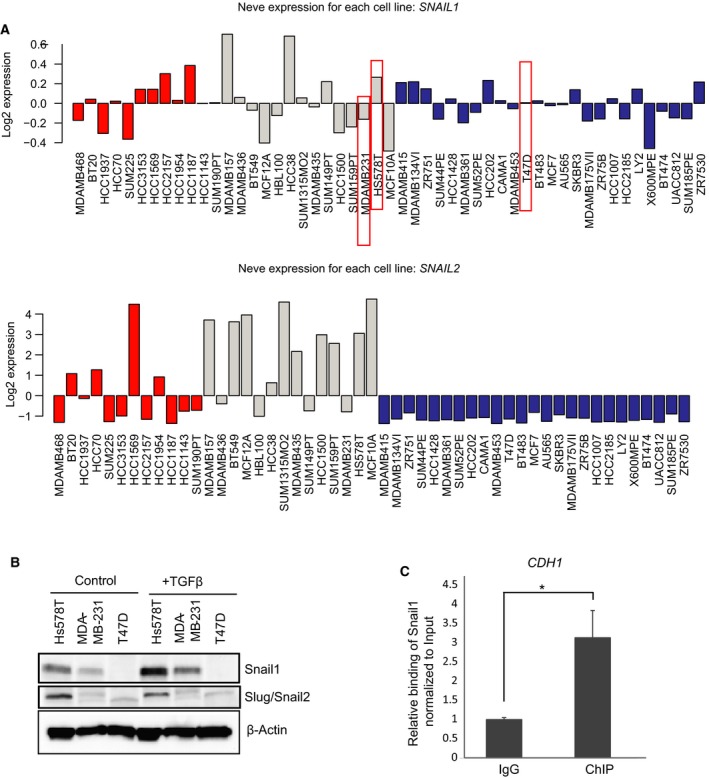
Hs578T breast cancer cells express high Snail1 levels. (A) Expression of SNAIL1 and Slug/SNAIL2 mRNA in different subtypes of breast cancers cell lines (basal‐A, red; basal‐B, gray; and luminal, blue) based on expression values derived from the GOBO database. (B) Immunoblot analysis showing protein expression of Snail1, Slug, and loading control β‐actin in Hs578T, MDA‐MB‐231, and T47D cells stimulated with vehicle (control) or TGFβ (5 ng·mL−1) for 9 h. (C) ChIP‐qPCR showing the significant enrichment (0.1% of the total input) of the CDH1 promoter region in a ChIP experiment using the Snail1 antibody, relative to the enrichment by nonspecific IgG. Statistical significance *P‐value = 0.037 is shown based on a Student's t‐test where n = 3, and average values along with SD are shown.
Although mRNA expression profiles are widely used, they do not always correlate with corresponding protein expression. For this reason, we screened two triple‐negative breast cancer cells of the basal‐B subgroup (Hs578T and MDA‐MB‐231) and one cell model of luminal epithelial breast cancer (T47D) for expression of Snail1 protein (Fig. 1B). This was necessitated by our aim to perform quantitative chromatin immunoprecipitation‐sequencing (ChIP‐seq) analysis in the tumor cells. We found that Hs578T cells of the basal‐B subgroup expressed high or detectable levels of endogenous Snail1 protein (Fig. 1B), in agreement with the mRNA analysis (Fig. 1A). The Snail1 protein levels of Hs578T cells were higher than the levels expressed in another mesenchymal and highly aggressive basal‐B breast cancer cell model, MDA‐MB‐231 cells (Fig. 1B). We also stimulated the cells with TGFβ1 to further enhance expression of Snail1 protein and observed significant induction of Snail1 in both Hs578T and MDA‐MB‐231 cells (Fig. 1B). Contrary to what was expected based on the mRNA profile (Fig. 1A), T47D luminal epithelial breast cancer cells did not express detectable Snail1 protein levels (Fig. 1B). Snail1 protein expression also correlated with Snail2/Slug protein levels (Fig. 1B).
Based on the above analysis, we selected Hs578T cells as the cell model for ChIP‐seq analysis. As the best‐established target of Snail1 transcriptional repression activity is E‐cadherin/CDH1, we confirmed that the endogenous Snail1 protein of these cells (Fig. 1B) could be detected bound to the CDH1 promoter, using ChIP‐qPCR analysis (Fig. 1C). Endogenous Snail1 was readily detectable as bound to the CDH1 promoter of Hs578T cells when compared to the input and unspecific IgG antibody. This assay also served as validation for the utility of Hs578T cells for the ChIP‐seq experiment.
4.2. A few hundred genomic sites are recognized by Snail1 in triple‐negative breast cancer cells
High‐yield ChIP using the Hs578T cells and the Snail1 antibody characterized in Fig. 1B, C was followed by sequence analysis (ChIP‐seq; Fig. 2A). Almost 405 sequence peaks were detected (after normalization relative to input chromatin), with a rate of alignment of the sequenced reads of roughly 80% in both input and immunoprecipitated chromatin DNA samples (Fig. 2A, Table S1). All of these peaks were annotated to 185 genes defined based on sequences relative to the transcriptional start site (TSS), 10 kbp upstream to 2.5 kbp downstream of various genes (Fig. 2A).
Figure 2.
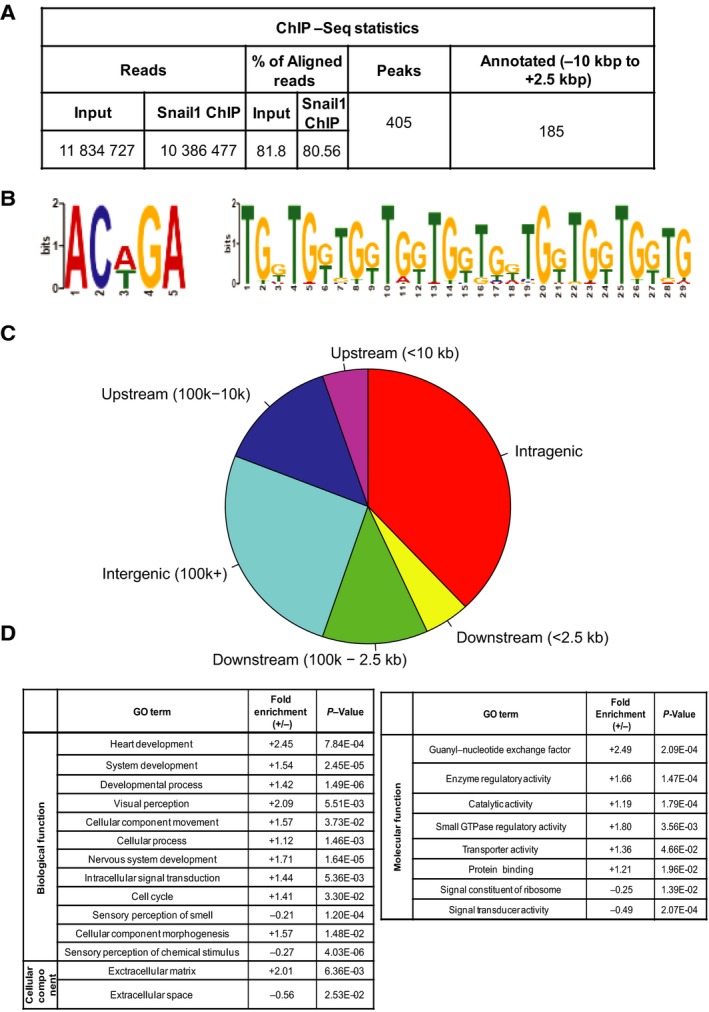
Snail1 associates with hundreds of genomic sites in triple‐negative breast cancer cells. (A) Table showing data and flow of analysis of a Snail1 ChIP‐seq experiment from sequence reads to annotated gene assignment of the Snail1 binding sites. (B) Visualization of statistically significant DNA motifs, derived from the Snail1 binding site sequences in Hs578T cells using the TOMTOM motif comparison tool. The sequence on the left is not, whereas the sequence to the right is centrally enriched. Sequence position is graphed on the x‐axis versus probability of frequency (bits) on the y‐axis. (C) Pie chart showing the relative location of Snail1 binding peaks on the Hg19 genome with respect to annotated genes. (D) GO analysis of annotated genes from the Snail1 ChIP‐seq peaks into molecular function, biological process and cellular component categories using the GO Panther database. Relative fold enrichment and P‐values indicate significance of each functional category.
We then identified the top DNA sequence motifs recognized by Snail1, revealing a TAL1/GATA1 sequence motif (ACA/TGA) and a repetitive TGG motif that is known to be recognized by the transcription factors RREB1, RUNX2, and PAX4 (Fig. 2B). The classical E‐box motif (CANNTG) to which Snail1 has been previously shown to bind (Barrallo‐Gimeno and Nieto, 2009; Baulida and Garcia de Herreros, 2015) was also identified but with lower statistical confidence (data not shown and Section 4 below). The repeated TGG motif was centrally enriched, whereas the ACA/TGA motif was not, suggesting possible direct regulation of target genes that encompass the TGG motif by Snail1. Further analysis of the 405 peaks revealed that their majority belonged to intragenic regions (Fig. 2C). The remaining peaks corresponded to other genomic regions extending from −100 to +100 kbp relative to the gene TSS (Fig. 2C).
Gene ontology enrichment analysis revealed that Snail1 associates with genes of diverse functional categories, including embryonic and central nervous system development, sensory perception, and heart development (Fig. 2D). Snail1 target genes showed a high fold of enrichment (+2.49) in the class of guanyl nucleotide exchange factors that participate in various signaling pathways (Fig. 2D). On the super class of cellular components, GO analysis showed that Snail1‐targeted genes had a higher relevance and fold enrichment toward the class of ECM genes (Fig. 2D).
4.3. Novel gene targets of Snail1 in breast cancer cells
Among the functional categories of genes to which significant association of Snail1 was measured (Fig. 2D), we validated the Crumbs1 (CRB1) gene that belongs to the cell polarity group and the protein phosphatase regulatory factor interacting protein α (PPFIA1) that belongs to the liprin family of regulators of the interaction between adhesion receptors and the ECM (Fig. 3). ChIP‐qPCR analysis based on primers corresponding to the DNA peaks identified in the ChIP‐seq experiment revealed that Snail1 binds to CRB1 and PPFIA1 significantly when compared to the input and unspecific IgG antibody (Fig. 3A, C). We then used the UCSC genome browser that provides location information of the pattern of several histone modifications, such as histone H3 lysine 27 acetylation (H3K27Ac), which mark transcriptional enhancer regions. We found that Snail1 binds near genomic regions that exhibit high transcriptional activity in these two genes (Fig. 3B, D). Nine additional genes were also validated for Snail1 binding using ChIP‐qPCR (data not shown).
Figure 3.
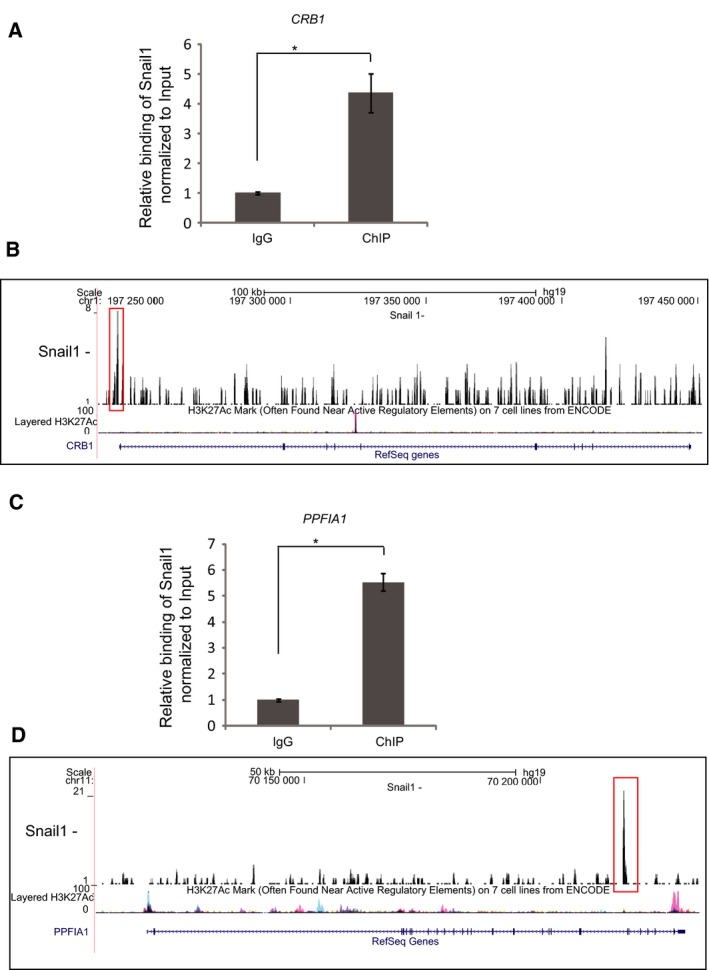
Novel gene targets of Snail1 in breast cancer cells. (A, C) ChIP‐qPCR showing the significant enrichment of the CRB1 (0.02% of the total input) (A) and PPFIA1 (0.05% of the total input) (C) promoter regions in a ChIP experiment using the Snail1 antibody, relative to the enrichment by nonspecific IgG. Statistical significance *P‐value = 8.76E‐04 and P‐value = 2.37E‐05, respectively, is shown based on a Student's t‐test where n = 3, and average values along with SD are shown. (B, D) Representation of Snail1 binding to the CRB1 (B) and PPFIA1 (D) genes; ChIP‐seq peaks (marked in red box) were aligned with tracks of H3K27Ac ChIP‐seq, which is used as a marker of gene activity, based on data available on the database, using the UCSC genome browser.
As ChIP assays do not prove direct binding of a transcription factor to a specific DNA sequence, but rather binding of the transcription factor to a chromatin locus to which a specific DNA sequence is closely associated, we performed DNA affinity precipitation (DNAP) experiments using synthetic double‐stranded oligonucleotides (Fig. 4). We selected four novel genes identified in the ChIP‐seq experiment and CDH1 as positive control (Fig. 4A). The five selected genes represent the three major DNA binding motif classes, the classical E‐box CANNTG (CPED1, BMP6 and CDH1), the TGG motif (BMP6 and PPF1A1), and the ACAGA motif (CRB1) (Fig. 4A); the oligonucleotide sequences were derived based on the center of specific peaks from the ChIP‐seq experiment. The bone morphogenetic protein 6 (BMP6) sequence included adjacent TGG and E‐box elements (Fig. 4A). To further increase the specificity of the assay, we employed DNAP experiments using total cell lysates from HEK‐293T cells transiently transfected with a plasmid expressing human Snail1 protein (Fig. 4B). Although this approach does not test purified, recombinant Snail1 protein, it provides highly expressed cellular Snail1, which acquires potentially necessary modifications that regulate its DNA binding activity. Figure 4B clearly demonstrates that all four (CPED1, BMP6, CRB1, and PPF1A1) newly identified Snail1‐binding sequences bound significant levels of cellular Snail1, to a comparable degree as one of the two E‐box motifs of the CDH1 promoter (CDH1‐A, mapping at −35 to −13 bp relative to the TSS). The second CDH1 E‐box motif (CDH1‐B, mapping at −86 to −64 bp relative to the TSS) bound Snail1 with much higher affinity (Fig. 4B). As specificity and negative controls, we used streptavidin beads that gave very low background binding and a mutant form of the PPFIA1 sequence (PPFIA1‐mut), which also resulted in low background binding, confirming the importance of the TGG motif (Fig. 4B). Based on the above experiments, we conclude that the genomewide analysis of Snail1 binding can be reproduced by ChIP‐qPCR and DNAP assays.
Figure 4.
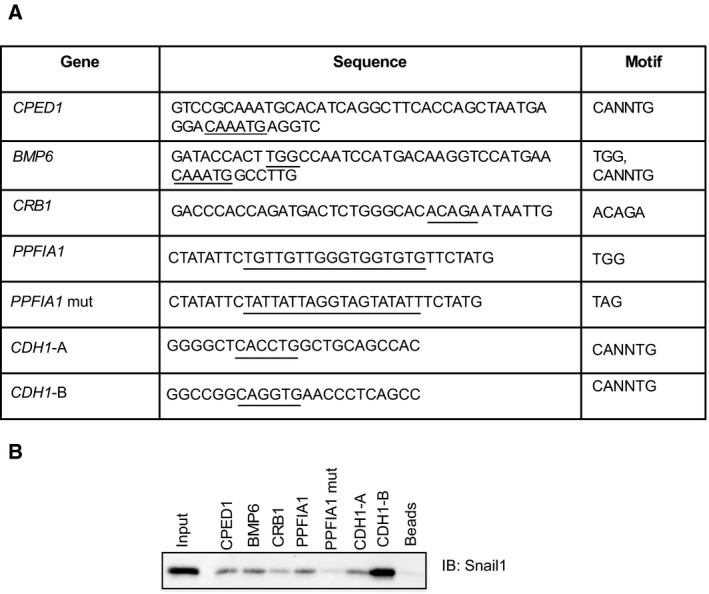
Binding of Snail1 to newly identified DNA sequences. (A) Selected genes and DNA sequences from these genes where Snail1 binding peaks were identified by ChIP‐seq (which were synthesized as biotinylated oligonucleotides), and corresponding motifs included in each gene sequence. (B) Binding of Snail1 protein expressed in transfected HEK‐293T cells and analyzed by DNAP using the specific DNA oligonucleotides of panel A. Input shows total cell lysate from the same cells prior to application to the biotinylated oligonucleotides and beads show negative control of streptavidin beads plus cell lysate in the absence of DNA.
4.4. Snail1 knockout reduces the ability of Hs578T cells to migrate
To confirm the existence of genes that are directly regulated by Snail1, we generated a complete knockout of the Snail1 gene in the Hs578T cells using the CRISPR/CAS9 gene editing protocol. We selected guideRNAs (gRNAs) that targeted two distinct regions of the Snail1 mRNA: the middle of exon1 that encodes for the Snail1 SNAG domain, and the exon2–intron2 junction (Fig. 5A, top panel), and cotransfected vectors expressing these gRNAs simultaneously into Hs578T cells. The selected stably transfected cells exhibited deletions of 10 bp each in the exon2–intron2 junction (CS24 clone) or deletions of 10 bp in both exon1 and the exon2–intron junction (CS26), as compared to control cells (C3) that carried the wild‐type DNA sequences (Fig. 5A, bottom panel). Several individual cell clones were selected, and most of them exhibited complete loss of Snail1 protein expression with a knockout success rate of more than 50%. Of nine Snail1 knockout clones that were characterized, two clones were further analyzed in deeper detail. Immunoblot analysis confirmed undetectable levels of Snail1 protein expression in clones CS24 and CS26 and in many additional knockout clones (Fig. 5B); further expression analysis of clone CS24 also showed dramatic loss of Snail1 mRNA expression (Fig. 5C). The knockout was specific for Snail1 and did not affect the related protein Snail2/Slug or the functionally related EMT‐TF ZEB1 (Fig. 5D). In fact, the Snail1 knockout cells exhibited slightly enhanced Slug protein levels (Fig. 5D), whereas ZEB1 levels remained constant in all three tested cell clones. Protein expression analysis of additional markers of epithelial (CAR) and mesenchymal (N‐cadherin, fibronectin) cells revealed that Snail1 knockout resulted in a relative good expression of the epithelial CAR, but also slightly stronger expression of the mesenchymal N‐cadherin and fibronectin (Fig. 5E). The latter is compatible with a phenotypic switch toward an intermediate phenotype that combines both mesenchymal and epithelial features (Nieto et al., 2016; Ye and Weinberg, 2015), an observation that requires deeper analysis.
Figure 5.
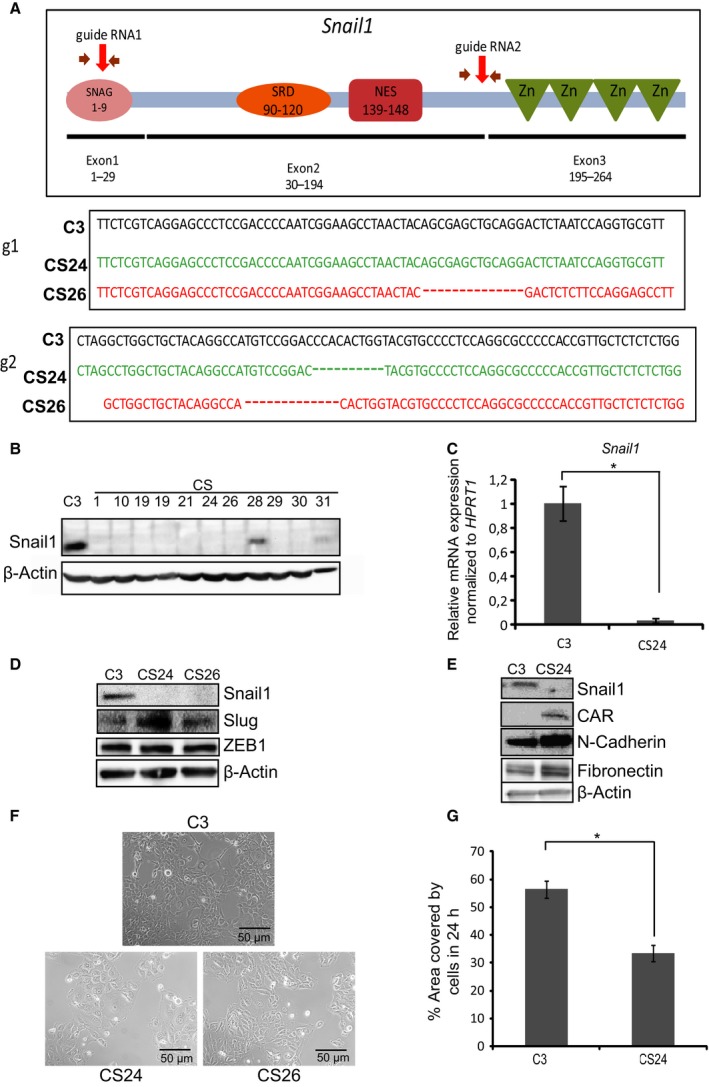
Snail1 knockout generates an intermediate phenotype and suppresses cell migration of Hs578T cells. (A) DNA sequences of the Snail1 gene in control C3 cells and deleted nucleotides in Snail1 knockout clones CS24 and CS26 after CRISPR‐/Cas9‐mediated knockout using specific gRNA‐containing plasmids (red arrows on the Snail1 gene cartoon). The latter graphs the human Snail1 protein with its functional domains, SNAG regulatory domain, serine‐rich domain (SRD), nuclear export signal (NES), and ZF, along with the corresponding three exons and numbering of the amino acid residues. (B) Immunoblot analysis showing Snail1 protein levels along with β‐actin levels that serve as protein loading control, in Hs578T cell clones C3 (control), Snail1 KO clones CS1, CS10, CS19, CS19 less protein, CS21, CS24, CS26, CS28, CS29, CS30, and CS31. (C) Quantification of Snail1 mRNA expression levels in C3 and CS24 clones. Statistical significance *P‐value = 0.0003 is shown based on a Student's t‐test where n = 3, and average values along with SD are shown. (D) Immunoblot analysis showing levels of Snail1, Slug, ZEB1, and β‐actin proteins in C3, CS24, and CS26 clones. (E) Protein analysis of Snail1, CAR, N‐cadherin, fibronectin, and β‐actin, in C3 and CS24 clones. (F) Phase contrast images showing cell morphology in C3, CS24, and CS26 Hs578T cell clones. Bars represent 50 μm. (F) Quantification of wound healing assays by the T‐scratch software, showing % of wound closure area 24 h after a scratch was made in C3 and CS24 Hs578T cell clones. Statistical significance *P‐value = 0.0007 is shown based on a Student's t‐test where n = 3, and average values along with SD are shown.
Another key phenotypic aspect that distinguishes epithelial from mesenchymal cells is their morphology (Nieto et al., 2016); microscopic analysis of the knockout cells showed a weak but observable change in cell morphology of CS24 and CS26 cells compared to control CS3 cells (Fig. 5F), which is also compatible with the generation of a mixed mesenchymal–epithelial phenotype, an observation that requires further analysis. In a T‐scratch cell migration assay, the CS24 cells exhibited significant delay in their migration relative to the control C3 cells (Fig. 5G). Thus, the Hs578T breast cancer cells expressed some distinguishable phenotypic changes upon loss of Snail1 expression, possibly indicating the generation of an intermediate differentiation stage toward the epithelial state.
4.5. Analysis of gene expression in Hs578T cells carrying a Snail1 knockout
The clean knockout system generated in the triple‐negative breast cancer Hs578T cells gave us the opportunity to perform a transcriptomic assay, using the AmpliSeq analysis that measures expression levels of all Ref‐Seq genes (Fig. 6). The assay uses targeted enrichment of over 21 000 genes, whose levels where measured in control C3 and Snail1 knockout CS24 cells (Fig. 6). This analysis produced data for 16 to 24.5 m reads out of which, over 99% aligned to the reference human genome (Fig. 6A, Table S2). After normalization of knockout (CS24) cell expression to control (C3) Hs578T gene expression, we identified 363 upregulated (blue dots) and 276 downregulated (red dots) genes, respectively, with the majority of expressed genes showing lack of change in expression (gray dots) (Fig. 6A, B). This transcriptomic analysis cannot discriminate between direct and indirect gene targets of Snail1. Unexpectedly, a substantial number of genes were downregulated in Snail1 knockout cells, suggesting that Snail1 positively regulates transcription, and this class of genes included primarily DNA binding, chromatin regulators, and genes involved in organelle organization and intracellular movement (Fig. 6D). On the other hand, Snail1 could repress a large set of genes involved in embryonic development (Fig. 6D). Among the genes whose expression remained constant after Snail1 knockout were the EMT‐TF genes Snail2/Slug, Twist1, and ZEB1 (Fig 6B, gray dots and not shown), which translated to weak Slug protein induction and stable ZEB1 protein expression (Fig. 5D).
Figure 6.
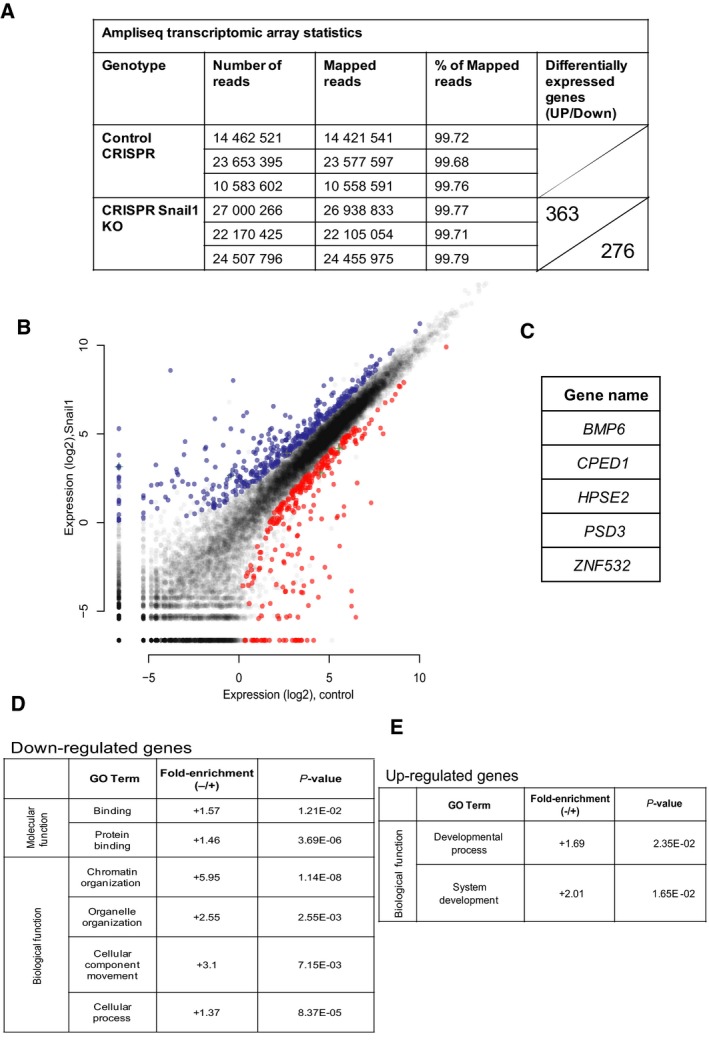
Transcriptomic analysis of genes regulated by Snail1. (A) Table showing data and flow of analysis using AmpliSeq transcriptomic arrays measuring gene expression in triplicate biological replicates of C3 (Control CRISPR) and CS24 (CRISPR Snail1 KO) Hs578T cell clones, from number of reads obtained to number of differentially expressed genes (upregulated: top sector, and downregulated: bottom sector). (B) Profile of all the Ref‐Seq genes based on their relative expression in the CS24 Hs578T cell clone plotted against the C3 Hs578T cell clone. Upregulated genes in the Snail1 knockout clone (blue) and downregulated genes (red color) along with statistically nonsignificant expressed genes (gray color) are plotted, and genes identified using the ChIP‐seq analysis (Fig. 1) are superimposed using a plus symbol. (C) List of the five genes that are marked with plus symbol in panel B. (D, E) GO analysis of annotated genes from the Snail1 knockout AmpliSeq experiment, classified into molecular function, biological process and cellular component categories using the GO panther database. Relative fold enrichment and P values indicate significance of gene classification in each functional category. The data are divided into (D) differentially expressed and significantly downregulated genes upon Snail1 knockout and (E) differentially expressed and significantly upregulated genes upon Snail1 knockout.
When the ChIP‐seq and transcriptomic array data were compared, only a few specific genes scored significantly in this overlap; five genes appear as direct Snail1 targets when the AmpliSeq expression data are overlayed with ChIP‐seq results (Fig. 6B, cross symbols; Fig. 6C, Table S2). GO analysis on this small subset of genes (BMP6, CPED1, HPSE2, PSD3, and ZNF532) did not show significant enrichment for any functional class of genes (data not shown), because of the low number of genes analyzed. The collective data suggest that Snail1 regulates the expression of several hundreds of genes, and a small subset may be direct target genes in triple‐negative breast cancer cells.
4.6. Regulators of bone homeostasis under the control of Snail1 in Hs578T cells
Among the 639 genes whose expression changed significantly upon knockout of Snail1 (Fig. 6), we paid further attention to two specific regulators of bone homeostasis because triple‐negative breast cancer cells often metastasize to the human skeleton and form osteolytic lesions (Nguyen et al., 2009), but more importantly because these two genes were regulated in an opposite manner, and Snail1 could associate with their respective genomic regulatory sequences (Fig. 4).
Bone morphogenetic protein 6 is a member of the TGFβ family that regulates bone development and is also involved in the process of stem cell differentiation and a specific metabolic pathway of iron homeostasis in the liver (Parrow and Fleming, 2014; Vukicevic and Grgurevic, 2009). The BMP6 gene scored both in the ChIP‐seq and transcriptomic analysis. ChIP‐qPCR quantification showed significant binding of Snail1 to the BMP6 promoter region (Fig. 7A), as mapped by DNAP (Fig. 4B). Upon Snail1 knockout, CS24 cells clearly demonstrated a significant reduction in BMP6 mRNA expression (Fig. 7B), which was nicely translated to the protein level as analyzed in clones CS24 and CS26 (Fig. 7C). These data suggest that the binding of Snail1 to this gene correlates with a positive regulatory activity on the expression of BMP6 mRNA. The comparative ChIP‐seq analysis further revealed that the transcriptional enhancer marker H3K27Ac also exhibited strong enrichment along the BMP6 gene body (Fig. 7D). To extend the data generated from the Hs578T cell model, we queried all the human breast cancer cell models included in the GOBO database (Fig. 7E) and identified 19 cell lines in which high‐level Snail1 correlated with high BMP6 or, inversely, low‐level Snail1 correlated with low‐level BMP6 (Fig. 7F). Interestingly, such positive correlations were not unique to the basal‐B group of breast cancer cells, but could be identified in basal‐A and luminal breast cancer cells, suggesting that Snail1 may regulate BMP6 expression in a large cohort of breast cancers.
Figure 7.
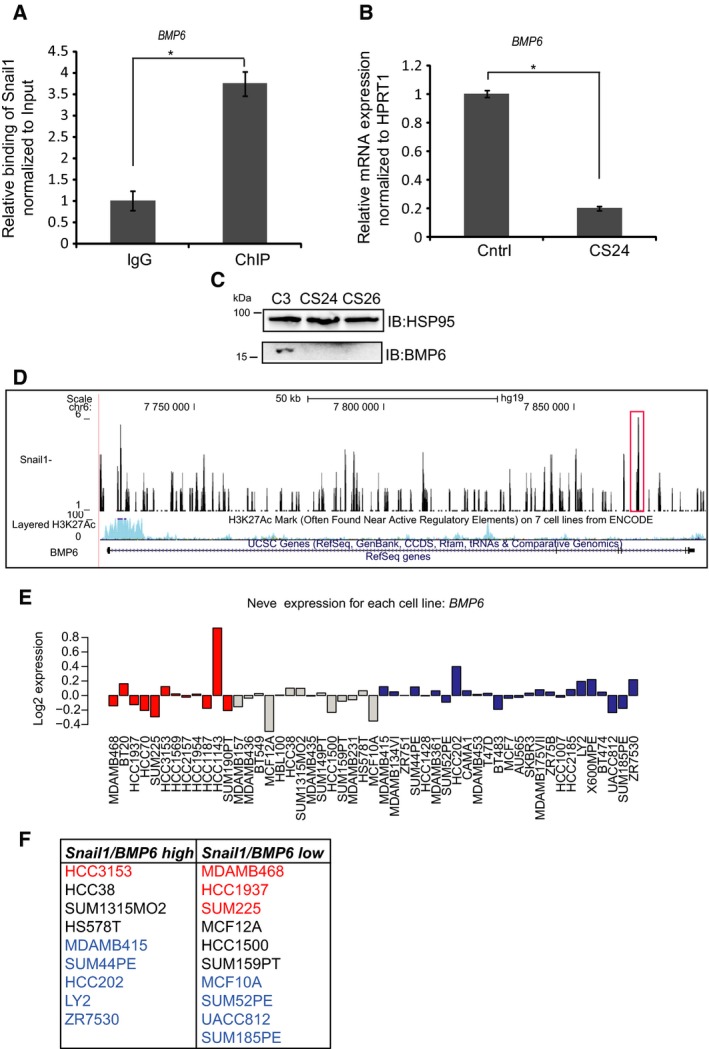
Snail1 regulates BMP6. (A) ChIP‐qPCR showing a significant enrichment (0.3% of the total input) of the BMP6 promoter region in a ChIP experiment using the Snail1 antibody, relative to the enrichment by nonspecific IgG. Statistical significance *P‐value = 0.0002 is shown based on a Student's t‐test where n = 3, and average values along with SD are shown. (B) Measurement of relative amount of BMP6 mRNA expressed in C3 and CS24 Hs578T cells after normalization with the HPRT1 housekeeping mRNA. Statistical significance *P‐value = 1.32E‐06 is shown based on a Student's t‐test where n = 3, and average values along with SD are shown. (C) Protein analysis of loading control HSP95 and mature monomeric BMP6 in C3, CS24, and CS26 clones. (D) Representation of Snail1 binding to the BMP6 gene; obtained ChIP‐seq peaks (marked in red box) and with tracks of H3K27Ac ChIP‐seq, which is used as a marker of enhancer activity, based on data available in the database, using the UCSC genome browser. (E) Expression of BMP6 mRNA in different subtypes of breast cancer cell lines (basal‐A, red; basal‐B, gray; and luminal, blue) based on expression values derived from the GOBO database. (F) The analysis of BMP6 mRNA expression using the GOBO database showed nine breast cancer cell lines with high SNAIL1 and high BMP6 expression and 10 with low SNAIL1 and low BMP6 expression. Each cell line is color‐coded according to their division in basal‐A, red; basal‐B, black; and luminal, blue.
The cadherin‐like and PC‐esterase domain containing 1 (CPED1) gene was also occupied by Snail1 in the ChIP‐seq analysis; ChIP‐qPCR assay confirmed the specificity of binding over control immunoglobulin and after normalization to the input DNA (Fig. 8A), and DNAP confirmed Snail1 binding to a short motif of the CPED1 gene (Fig. 4B). The expression of CPED1 mRNA was measurable in control C3 Hs578T cells and became significantly increased after Snail1 knockout in CS24 cells (Fig. 8B). Analyzing endogenous CPED1 protein expression in C3 cells transiently transfected with a human Snail1‐expressing vector confirmed relative downregulation of CPED1 (Fig. 8C), whereas CPED1 protein was significantly upregulated in the Snail1 knockout clone CS24 (Fig. 8D), in agreement with the mRNA profile in the same cells (Fig. 8B).
Figure 8.
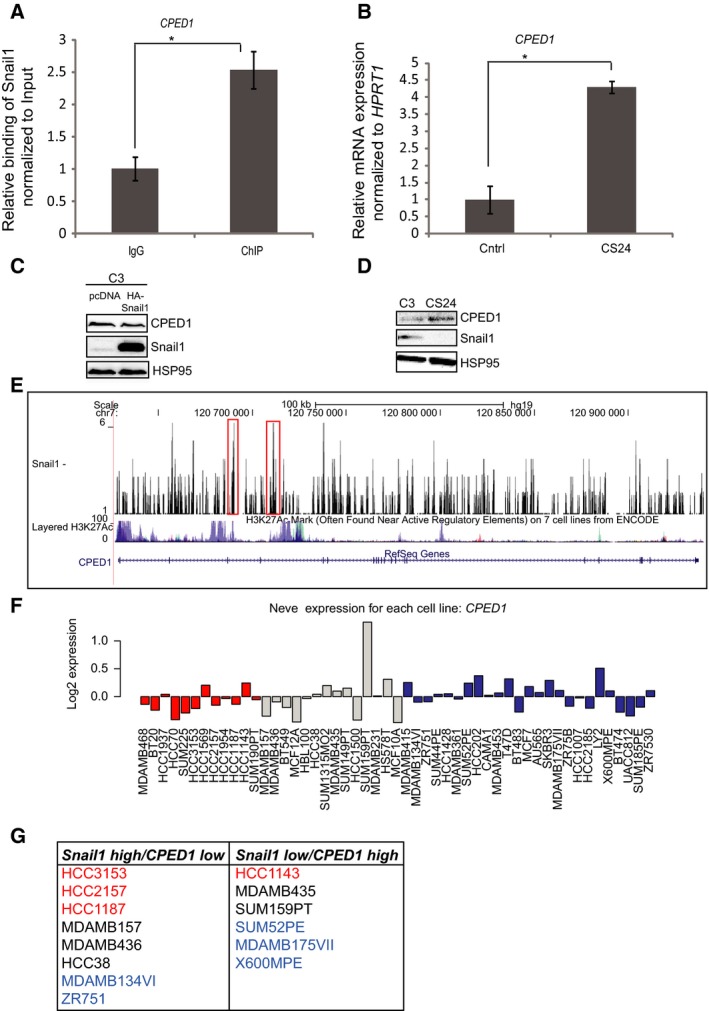
CPED1 is a novel target gene of Snail1. (A) ChIP‐qPCR showing a significant enrichment (0.2% of the total input) of the CPED1 promoter region in a ChIP experiment using the Snail1 antibody, relative to the enrichment by nonspecific IgG. Statistical significance *P‐value = 0.0015 is shown based on a Student's t‐test where n = 3, and average values along with SD are shown. (B) Measurement of relative amount of CPED1 mRNA expressed in C3 and CS24 Hs578T cells after normalization with the HPRT1 housekeeping mRNA. Statistical significance *P‐value = 0.0002 is shown based on a Student's t‐test where n = 3, and average values along with SD are shown. (C) Protein analysis of CPED1, Snail1, and HSP95 in C3 clones transfected with pcDNA3 empty vector and HA‐Snail1 plasmid. (D) Protein analysis of CPED1, Snail1, and HSP95 in C3 and CS24 clones. (E) Representation of Snail1 binding to the CPED1 gene; obtained ChIP‐seq peaks (marked in red box) and with tracks of H3K27Ac ChIP‐seq, which is used as a marker of enhancer activity, based on data available in the UCSC genome browser. (F) Expression of CPED1 mRNA in different subtypes of breast cancers cell lines (basal‐A, red; basal‐B, gray; and luminal, blue) based on expression values derived from the GOBO database. (G) The analysis of CPED1 mRNA expression using the GOBO database showed eight breast cancer cell lines with high SNAIL1 and low CPED1 expression and six with low SNAIL1 and high CPED1 expression. Each cell line is color‐coded according to their division in basal‐A, red; basal‐B, black; and luminal, blue.
Multiple peaks of Snail1 binding associated with the CPED1 gene, many of which overlapped with the H3K27Ac marks on the chromatin of this gene (Fig. 8E). CPED1 is a gene that has been genetically linked via genomewide association studies to the regulation of bone mass in humans (Chesi et al., 2015). The molecular and cellular function of CPED1 protein remains unknown. These data suggest that Snail1 actively represses the CPED1 gene in the triple‐negative breast cancer cells, and upon loss of Snail1, the gene becomes de‐repressed, which enhances its expression. We therefore suggest that CPED1 may represent a gene whose transcriptional repression by Snail1 may be important for a subset of breast cancers. We queried the human breast cancer cell collection of the GOBO database (Fig. 8F) and identified 14 cell lines in which high‐level Snail1 correlated with low CPED1, or inversely, low‐level Snail1 correlated with high‐level CPED1 (Fig. 8G). Similar to the analysis of BMP6 expression, the data suggest that Snail1 may regulate CPED1 expression in all subtypes of breast cancers.
5. Discussion
Snail1 is a transcription factor, whose function is intimately linked to the process of EMT, tumor cell invasive and metastatic abilities, and the generation of stem‐like cancer cells (Barrallo‐Gimeno and Nieto, 2009; Baulida and Garcia de Herreros, 2015; Lambert et al., 2017). Today, we understand several details of how Snail1 mediates the EMT by repressing target genes such as CDH1 and a few other genes involved in epithelial cell polarity and cell–cell adhesion (Baulida and Garcia de Herreros, 2015; Nieto et al., 2016). However, few of the EMT studies focusing on Snail1 function have been performed in human cancer cells that naturally express Snail1; they have rather been performed in relatively normal or benign tumor cells engineered to overexpress Snail1 after transfection.
Based on this reality, we studied triple‐negative breast cancer cells (Fig. 1) and analyzed the prolife of association of Snail1 at the genomewide level, which revealed several hundred genomic loci (Fig. 2). Using CRISPR/Cas9 as a tool to genetically inactivate endogenous Snail1 in the cancer cells (Fig. 5), we identified several hundreds of genes, whose expression was affected by the absence of Snail1 (Fig. 6), suggesting that Snail1 endogenously supports a significant genetic program of the breast cancer cell. This experimental approach resulted in the identification of several previously unappreciated genes, whose expression can be regulated by Snail1, and furthermore, it functionally established that removal of a major EMT‐TF from the triple‐negative breast cancer cells showed significant repression of cell motility (Fig. 5); however, it was sufficient to induce only partial or weak signs of reversion to a more epithelial phenotype, reflecting an intermediate phenotype of cell differentiation (Fig. 5).
Previous studies associated the transcriptional repressive activity of Snail1 with the loss of expression of various epithelial genes in tumor cells, including the cell–cell contact genes CDH1 (Batlle et al., 2000; Cano et al., 2000) and CLAUDIN1 (Martinez‐Estrada et al., 2006), the ECM component MUC1 (Guaita et al., 2002), and the polarity regulator CRUMBS3 (Whiteman et al., 2008). In addition, Snail1 represses pro‐apoptotic genes and the FBP1 gene, thus promoting the metabolism of cancer stem cells (Dong et al., 2013b; Vega et al., 2004).
The analysis presented here has revealed a significant number of previously not appreciated potential targets of Snail1 transcriptional activity (Figs 2, 6). This probably reflects the origin of the host cell, triple‐negative breast cancer cells Hs578T. The Hs578T cells belong to the claudin‐low subgroup of basal‐B breast cancers and exhibit strong mesenchymal features (Fig. 1A) (Hennessy et al., 2009; Shipitsin et al., 2007; Taube et al., 2010). It is worth noting that at the onset of this work, we attempted to analyze genomewide Snail1 occupancy in several cell models of breast cancer; however, we identified very few whose endogenous Snail1 protein level permitted quantitative ChIP‐seq (Fig. 1B). This is in contrast to a wide array of transcriptomic analyses that report high levels of Snail1 mRNA in a variety of breast cancers, including the breast cancer cell lines analyzed in Fig. 1A. To a certain approximation, the difference between Snail1 mRNA and protein levels can be justified based on the well‐established regulation of Snail1 stability post‐translationally, via phosphorylation, ubiquitin‐mediated degradation, or miRNAs (Díaz and de Herreros, 2016).
Based on ChIP‐Seq analysis, we have identified several hundreds of genomic sites where Snail1 binds, many of which mapped within a range of 10 kbp or less from the TSS of well‐characterized gene bodies (Fig. 2A, C). Snail1 is known to bind to the E‐box of the proximal CDH1 (Batlle et al., 2000; Cano et al., 2000). Using the genomewide data, we could identify two additional DNA sequence motifs that represented the majority of the binding sites where Snail1 localized (Fig. 2B). These are the TAL/GATA1 motif and the repetitive TGG motif of RREB1/RUNX2/PAX4, suggesting that Snail1 exhibits a rather restrictive binding specificity when compared to other transcription factors. In our ChIP‐seq experiment, the E‐box was also identified but with lower statistical confidence (data not shown). Validation of the ChIP‐seq analysis using ChIP‐qPCR clearly demonstrated binding of Snail1 to the CDH1 promoter that encompasses the E‐boxes in Hs578T cells (Fig. 1C) and to four representative genes among those newly identified (Figs 3A, C, 7A, 8A). Further validation by DNAP confirmed that all identified sequence motifs were genuine in terms of the ability of Snail1 to associate with them with high affinity, which is comparable to the binding affinity on the CDH1 E‐box (Fig. 4B).
The method of genetic inactivation of Snail1 using CRISPR/Cas9‐based recombination proved rather successful (Fig. 5). A similar approach was earlier used in an ovarian cancer cell model (RMG‐1 cells) and demonstrated that knockout of Snail1 generated ovarian cancer cells with stronger cell–cell contacts and a cytoskeletal organization that resembled that of epithelial cells (Haraguchi et al., 2015). A similar phenotypic change was observed in the breast cancer Hs578T cells, as the cells adopted tighter cell–cell contacts and reduced migratory ability (Fig. 5F, G). However, similar to the ovarian cancer cells, Hs578T cells lacking Snail1 protein expression did not revert to fully epithelial cells. This is partly because of the redundant function of the multiple EMT‐TFs that are highly expressed in the Hs578T cells, such as Snail2/Slug and ZEB1 (Fig. 1B). The expression of these two EMT‐TFs remained strong in the Snail1 knockout cells, and Slug was even slightly induced (Fig. 1B, gray dotes). Thus, loss of a single EMT‐TF can support a MET and promote epithelial characteristics in tumor cells, but the presence of other EMT‐TFs compensate by providing strong enough signals that support the mesenchymal differentiation of such breast cancer cells. The protein marker analysis (Fig. 5E) supports this conclusion and suggests that the Snail1 knockout Hs578T cells best resemble an intermediate phenotype that coexpresses both mesenchymal and epithelial proteins. Furthermore, the migratory ability of Hs578T cells relies significantly on the function of Snail1 as these knockout cells exhibited lower migratory ability (Fig. 5G). The lack of reversion of E‐cadherin expression after Snail1 knockout implies an alternative mechanism for the reduced migratory phenotype of the knockout cells, which may involve other genes transcriptionally induced by active Snail1.
The transcriptomic analysis generated a list of 639 genes whose levels changed after Snail1 knockout (Fig. 6). Many of these genes provide fresh ideas regarding the function of Snail1 in breast cancer. For example, whereas transcriptional repression of the polarity gene CRUMBS3 by Snail1 has been firmly established (Whiteman et al., 2008), we now provide evidence that Snail1 binds to the related member of the Crumbs family, CRB1 (Fig. 3A, B). CRB1 expression is highly regulated when the epithelial polarity and morphogenesis changes during carcinoma progression (Bazellières et al., 2009; Halaoui and McCaffrey, 2015). This is because CRB1 makes direct contact with adaptor proteins such as zonula occludens 3 and facilitates the assembly of epithelial tight junctions (Roh et al., 2002). Disassembly of tight junctions is a hallmark of EMT (Nieto et al., 2016), and thus, binding of Snail1 to the CRB1 gene may indicate an extensive transcriptional network whereby Snail1 transcriptionally represses several members of the epithelial polarity machinery. A second gene that exhibits strong binding of Snail1 is PPFIA1 (Fig. 3C, D). Liprin family adaptors, including Liprin‐α1/PPFIA1, regulate cell motility, invadopodia, and ECM degradation in breast cancer cells (Astro et al., 2011; Chiaretti and de Curtis, 2016). In addition, PPFIA1 mediates organization of the vimentin cytoskeleton (Pehkonen et al., 2016). Regulation of liprin expression by EMT‐TFs has not been previously appreciated. It is therefore possible that transcriptional induction of PPFIA1 by Snail1 may contribute to the invasive phenotype of breast cancer cells and the induction of vimentin intermediate filament assembly, a hallmark of EMT. Such functional relevance for CRB1 and PPFIA1 gene regulation by Snail1 awaits future investigation. Snail1 also binds and positively regulates BMP6 gene expression (Fig. 7). Whereas BMP6 is best known for its contribution to mesenchymal stem cell biology and the regulation of iron metabolism in the liver (Parrow and Fleming, 2014; Vukicevic and Grgurevic, 2009), evidence links BMP6 to the process of MET. Specifically, BMP6 signaling leads to downregulation of ZEB1 and preservation of epithelial features in breast cancer cells, whereas breast cancer cells undergoing EMT exhibit loss of BMP6 expression due to methylation of DNA sequences on the BMP6 gene (Liu et al., 2014; Yang et al., 2007). These reports suggest that Snail1 might act as a transcriptional repressor of BMP6. However, our data suggest a positive role for Snail1 in BMP6 expression (Fig. 7). We propose that the coordinate expression of ZEB1, Snail2, and Snail1 in the Hs578T cells supports BMP6 expression, whereas loss of Snail1 in the knockout cell clones reveals a dominant role of the other EMT‐TFs in repressing BMP6, whose expression is reduced and thus possibly indirectly contributes to the sustained expression of ZEB1 (Fig. 5D). A last example is the CPED1 gene, which is repressed by Snail1 binding and whose expression is de‐repressed upon Snail1 knockout (Fig. 8). The biology of CPED1 remains unexplored, and so far, this gene is linked to bone disorders based on genomewide association studies (Chesi et al., 2015). It is therefore intriguing to propose that CPED1 repression by Snail1 may be linked to the maintenance of BMP6 expression; however, a molecular link between BMP6 signaling and CPED1 function remains to be tested. Taken together, the gene expression analysis supports both positive and negative regulation of transcription by Snail1.
6. Conclusion
In conclusion, our work on Snail1 in human breast cancer cells has generated an extensive resource for novel discoveries in the context of Snail1‐mediated transcriptional regulation and EMT. This study also opens the interesting possibility of identifying Snail1 target genes, whose function may be possible to be suppressed together with the loss of Snail1 function, and thus generates breast cancer cells with more epithelial features (MET), thus providing means for synthetic lethality that could eliminate these breast cancer cells. Loss of the prosurvival signals generated by Snail1 promise such an approach in the continuous attempt to generate conditions that elicit tumor eradication.
Author contributions
AM performed conception. VM and AM performed design. AM and VM acquired data. AM, VM, and SE analyzed data. VM, SE, CHH, and AM interpreted data. VM, SE, CHH, and AM involved in article drafting and critical revision for important intellectual content. VM, SE, CHH, and AM finally approved the study prior to publication.
Supporting information
Table S1. An Excel file including primary data from the ChIP‐Seq analysis.This file tabulates in an organized manner the raw data deposited in Array Express under accession number E‐MTAB‐5242. The data are organized as: chromosome number, peak start, peak end, MACS, peak score, gene start, gene end, gene name, transcribed strand and distance from the gene start.
Table S2. An Excel file presenting the primary data from the AmpliSeq analysis.This file tabulates in an organized manner the raw data deposited in Array Express under accession number E‐MTAB‐5244. The data are organized as: Gene name, Target ID, ENTREZ_GENE_ID, normalized expression values in triplicate samples of the mock C3 clone (up_242_1, up_242_2, up_242_3) and the Snail1 KO CZ1 clone (up_242_7, up_242_8, up_242_9), mean of the mock C3 clone expression (meanCtrl), mean of the Snail1 KO CZ1 clone expression (mean Snail1), fold‐change in expression between Snail1 KO CS24 and control C3 cells (absMeanFC), p value (pval), adjusted p value (padj), differentially expressed gene (DEG) and coincidence with the ChIP‐Seq peaks (chipSeqPeak).
Acknowledgements
We thank Eleftheria Vasilaki, Anders Sundqvist and Masato Morikawa (Ludwig Institute for Cancer Research, Uppsala Branch, Sweden) for reagents and advice during the course of this work, and members of our laboratory for suggestions and useful discussions. We thank Anusha Nagari (UT Southwest Medical Center, Dallas, TX, USA) for useful discussions during the progression of the work. We thank J. Staaf and Å. Borg (Lund University, Sweden) for access to the GOBO database. Sequencing was performed at the National Genomics Infrastructure Uppsala (Uppsala Genome Center) of the Science for Life Laboratory, Sweden. The computations were performed on resources provided by SNIC through the Uppsala Multidisciplinary Center for Advanced Computational Science (UPPMAX) under Project b2013260. This work was supported by the Ludwig Institute for Cancer Research, the Swedish Cancer Society (Project Numbers: CAN 2012/438, CAN 2015/438 to AM; CAN 2016/445 to CHH), and the Swedish Research Council (Project Numbers K2013‐66X‐14936‐10‐5 to AM and 2015‐02757 to CHH).
References
- Astro V, Asperti C, Cangi MG, Doglioni C and de Curtis I (2011) Liprin‐a1 regulates breast cancer cell invasion by affecting cell motility, invadopodia and extracellular matrix degradation. Oncogene 30, 1841–1849. [DOI] [PubMed] [Google Scholar]
- Bachelder RE, Yoon SO, Franci C, de Herreros AG and Mercurio AM (2005) Glycogen synthase kinase‐3 is an endogenous inhibitor of Snail transcription: implications for the epithelial‐mesenchymal transition. J Cell Biol 168, 29–33. [DOI] [PMC free article] [PubMed] [Google Scholar]
- Bailey TL, Boden M, Buske FA, Frith M, Grant CE, Clementi L, Ren J, Li WW and Noble WS (2009) MEME SUITE: tools for motif discovery and searching. Nucleic Acids Res 37, W202–W208. [DOI] [PMC free article] [PubMed] [Google Scholar]
- Barrallo‐Gimeno A and Nieto MA (2009) Evolutionary history of the Snail/Scratch superfamily. Trends Genet 25, 248–252. [DOI] [PubMed] [Google Scholar]
- Batlle R, Alba‐Castellon L, Loubat‐Casanovas J, Armenteros E, Franci C, Stanisavljevic J, Banderas R, Martin‐Caballero J, Bonilla F, Baulida J et al (2013) Snail1 controls TGF‐β responsiveness and differentiation of mesenchymal stem cells. Oncogene 32, 3381–3389. [DOI] [PMC free article] [PubMed] [Google Scholar]
- Batlle E, Sancho E, Franci C, Dominguez D, Monfar M, Baulida J and Garcia De Herreros A (2000) The transcription factor snail is a repressor of E‐cadherin gene expression in epithelial tumour cells. Nat Cell Biol 2, 84–89. [DOI] [PubMed] [Google Scholar]
- Baulida J and Garcia de Herreros A (2015) Snail1‐driven plasticity of epithelial and mesenchymal cells sustains cancer malignancy. Biochim Biophys Acta 1856, 55–61. [DOI] [PubMed] [Google Scholar]
- Bazellières E, Assemat E, Arsanto JP, Le Bivic A and Massey‐Harroche D (2009) Crumbs proteins in epithelial morphogenesis. Front Biosci 14, 2149–2169. [DOI] [PubMed] [Google Scholar]
- Bierie B and Moses HL (2006) Tumour microenvironment: TGFβ: the molecular Jekyll and Hyde of cancer. Nat Rev Cancer 6, 506–520. [DOI] [PubMed] [Google Scholar]
- Blanco MJ, Moreno‐Bueno G, Sarrio D, Locascio A, Cano A, Palacios J and Nieto MA (2002) Correlation of Snail expression with histological grade and lymph node status in breast carcinomas. Oncogene 21, 3241–3246. [DOI] [PubMed] [Google Scholar]
- Cano A, Perez‐Moreno MA, Rodrigo I, Locascio A, Blanco MJ, del Barrio MG, Portillo F and Nieto MA (2000) The transcription factor snail controls epithelial‐mesenchymal transitions by repressing E‐cadherin expression. Nat Cell Biol 2, 76–83. [DOI] [PubMed] [Google Scholar]
- Chesi A, Mitchell JA, Kalkwarf HJ, Bradfield JP, Lappe JM, McCormack SE, Gilsanz V, Oberfield SE, Hakonarson H, Shepherd JA et al (2015) A trans‐ethnic genome‐wide association study identifies gender‐specific loci influencing pediatric aBMD and BMC at the distal radius. Hum Mol Genet 24, 5053–5059. [DOI] [PMC free article] [PubMed] [Google Scholar]
- Chiaretti S and de Curtis I (2016) Role of liprins in the regulation of tumor cell motility and invasion. Curr Cancer Drug Targets 16, 238–248. [DOI] [PubMed] [Google Scholar]
- Dave N, Guaita‐Esteruelas S, Gutarra S, Frias A, Beltran M, Peiro S and de Herreros AG (2011) Functional cooperation between Snail1 and twist in the regulation of ZEB1 expression during epithelial to mesenchymal transition. J Biol Chem 286, 12024–12032. [DOI] [PMC free article] [PubMed] [Google Scholar]
- Dhasarathy A, Phadke D, Mav D, Shah RR and Wade PA (2011) The transcription factors snail and slug activate the transforming growth factor‐β signaling pathway in breast cancer. PLoS One 6, e26514. [DOI] [PMC free article] [PubMed] [Google Scholar]
- Díaz VM and de Herreros AG (2016) F‐box proteins: keeping the epithelial‐to‐mesenchymal transition (EMT) in check. Semin Cancer Biol 36, 71–79. [DOI] [PubMed] [Google Scholar]
- Dong C, Wu Y, Wang Y, Wang C, Kang T, Rychahou PG, Chi YI, Evers BM and Zhou BP (2013a) Interaction with Suv39H1 is critical for Snail‐mediated E‐cadherin repression in breast cancer. Oncogene 32, 1351–1362. [DOI] [PMC free article] [PubMed] [Google Scholar]
- Dong C, Wu Y, Yao J, Wang Y, Yu Y, Rychahou PG, Evers BM and Zhou BP (2012) G9a interacts with Snail and is critical for Snail‐mediated E‐cadherin repression in human breast cancer. J Clin Invest 122, 1469–1486. [DOI] [PMC free article] [PubMed] [Google Scholar]
- Dong C, Yuan T, Wu Y, Wang Y, Fan TW, Miriyala S, Lin Y, Yao J, Shi J, Kang T et al (2013b) Loss of FBP1 by Snail‐mediated repression provides metabolic advantages in basal‐like breast cancer. Cancer Cell 23, 316–331. [DOI] [PMC free article] [PubMed] [Google Scholar]
- Grande MT, Sanchez‐Laorden B, Lopez‐Blau C, De Frutos CA, Boutet A, Arevalo M, Rowe RG, Weiss SJ, Lopez‐Novoa JM and Nieto MA (2015) Snail1‐induced partial epithelial‐to‐mesenchymal transition drives renal fibrosis in mice and can be targeted to reverse established disease. Nat Med 21, 989–997. [DOI] [PubMed] [Google Scholar]
- Guaita S, Puig I, Franci C, Garrido M, Dominguez D, Batlle E, Sancho E, Dedhar S, De Herreros AG and Baulida J (2002) Snail induction of epithelial to mesenchymal transition in tumor cells is accompanied by MUC1 repression and ZEB1 expression. J Biol Chem 277, 39209–39216. [DOI] [PubMed] [Google Scholar]
- Halaoui R and McCaffrey L (2015) Rewiring cell polarity signaling in cancer. Oncogene 34, 939–950. [DOI] [PubMed] [Google Scholar]
- Haraguchi M, Sato M and Ozawa M (2015) CRISPR/Cas9n‐mediated deletion of the Snail 1gene (SNAI1) reveals its role in regulating cell morphology, cell‐cell interactions, and gene expression in ovarian cancer (RMG‐1) cells. PLoS One 10, e0132260. [DOI] [PMC free article] [PubMed] [Google Scholar]
- Hennessy BT, Gonzalez‐Angulo AM, Stemke‐Hale K, Gilcrease MZ, Krishnamurthy S, Lee JS, Fridlyand J, Sahin A, Agarwal R, Joy C et al (2009) Characterization of a naturally occurring breast cancer subset enriched in epithelial‐to‐mesenchymal transition and stem cell characteristics. Cancer Res 69, 4116–4124. [DOI] [PMC free article] [PubMed] [Google Scholar]
- Herrera A, Herrera M, Alba‐Castellon L, Silva J, Garcia V, Loubat‐Casanovas J, Alvarez‐Cienfuegos A, Miguel Garcia J, Rodriguez R, Gil B et al (2014) Protumorigenic effects of Snail‐expression fibroblasts on colon cancer cells. Int J Cancer 134, 2984–2990. [DOI] [PubMed] [Google Scholar]
- Kent WJ, Sugnet CW, Furey TS, Roskin KM, Pringle TH, Zahler AM and Haussler D (2002) The human genome browser at UCSC. Genome Res 12, 996–1006. [DOI] [PMC free article] [PubMed] [Google Scholar]
- Lambert AW, Pattabiraman DR and Weinberg RA (2017) Emerging biological principles of metastasis. Cell 168, 670–691. [DOI] [PMC free article] [PubMed] [Google Scholar]
- Li H, Handsaker B, Wysoker A, Fennell T, Ruan J, Homer N, Marth G, Abecasis G, Durbin R, Genome project data processing S (2009) The sequence alignment/map format and SAMtools. Bioinformatics 25, 2078–2079. [DOI] [PMC free article] [PubMed] [Google Scholar]
- Liu G, Liu YJ, Lian WJ, Zhao ZW, Yi T and Zhou HY (2014) Reduced BMP6 expression by DNA methylation contributes to EMT and drug resistance in breast cancer cells. Oncol Rep 32, 581–588. [DOI] [PubMed] [Google Scholar]
- Martinez‐Estrada OM, Culleres A, Soriano FX, Peinado H, Bolos V, Martinez FO, Reina M, Cano A, Fabre M and Vilaro S (2006) The transcription factors Slug and Snail act as repressors of Claudin‐1 expression in epithelial cells. Biochem J 394, 449–457. [DOI] [PMC free article] [PubMed] [Google Scholar]
- Medici D, Hay ED and Goodenough DA (2006) Cooperation between snail and LEF‐1 transcription factors is essential for TGF‐β1‐induced epithelial‐mesenchymal transition. Mol Biol Cell 17, 1871–1879. [DOI] [PMC free article] [PubMed] [Google Scholar]
- Mi H, Muruganujan A and Thomas PD (2013) PANTHER in 2013: modeling the evolution of gene function, and other gene attributes, in the context of phylogenetic trees. Nucl Acids Res 41, D377–D386. [DOI] [PMC free article] [PubMed] [Google Scholar]
- Moustakas A and Heldin C‐H (2012) Induction of epithelial‐mesenchymal transition by transforming growth factor β. Semin Cancer Biol 22, 446–454. [DOI] [PubMed] [Google Scholar]
- Nguyen DX, Bos PD and Massagué J (2009) Metastasis: from dissemination to organ‐specific colonization. Nat Rev Cancer 9, 274–284. [DOI] [PubMed] [Google Scholar]
- Nieto MA, Huang RY, Jackson RA and Thiery J‐P (2016) EMT: 2016. Cell 166, 21–45. [DOI] [PubMed] [Google Scholar]
- Olmeda D, Jorda M, Peinado H, Fabra A and Cano A (2007) Snail silencing effectively suppresses tumour growth and invasiveness. Oncogene 26, 1862–1874. [DOI] [PubMed] [Google Scholar]
- Parrow NL and Fleming RE (2014) Bone morphogenetic proteins as regulators of iron metabolism. Annu Rev Nutr 34, 77–94. [DOI] [PMC free article] [PubMed] [Google Scholar]
- Pehkonen H, von Nandelstadh P, Karhemo PR, Lepikhova T, Grenman R, Lehti K and Monni O (2016) Liprin‐a1 is a regulator of vimentin intermediate filament network in the cancer cell adhesion machinery. Sci Rep 6, 24486. [DOI] [PMC free article] [PubMed] [Google Scholar]
- Peinado H, Ballestar E, Esteller M and Cano A (2004) Snail mediates E‐cadherin repression by the recruitment of the Sin3A/histone deacetylase 1 (HDAC1)/HDAC2 complex. Mol Cell Biol 24, 306–319. [DOI] [PMC free article] [PubMed] [Google Scholar]
- Peinado H, Quintanilla M and Cano A (2003) Transforming growth factor β‐1 induces snail transcription factor in epithelial cell lines: mechanisms for epithelial mesenchymal transitions. J Biol Chem 278, 21113–21123. [DOI] [PubMed] [Google Scholar]
- Perez‐Mancera PA, Perez‐Caro M, Gonzalez‐Herrero I, Flores T, Orfao A, de Herreros AG, Gutierrez‐Adan A, Pintado B, Sagrera A, Sanchez‐Martin M et al (2005) Cancer development induced by graded expression of Snail in mice. Hum Mol Genet 14, 3449–3461. [DOI] [PubMed] [Google Scholar]
- Quinlan AR and Hall IM (2010) BEDTools: a flexible suite of utilities for comparing genomic features. Bioinformatics 26, 841–842. [DOI] [PMC free article] [PubMed] [Google Scholar]
- Ringner M, Fredlund E, Hakkinen J, Borg Å and Staaf J (2011) GOBO: gene expression‐based outcome for breast cancer online. PLoS One 6, e17911. [DOI] [PMC free article] [PubMed] [Google Scholar]
- Rodriguez MI, Gonzalez‐Flores A, Dantzer F, Collard J, de Herreros AG and Oliver FJ (2011) Poly(ADP‐ribose)‐dependent regulation of Snail1 protein stability. Oncogene 30, 4365–4372. [DOI] [PubMed] [Google Scholar]
- Roh MH, Liu CJ, Laurinec S and Margolis B (2002) The carboxyl terminus of zona occludens‐3 binds and recruits a mammalian homologue of discs lost to tight junctions. J Biol Chem 27, 27501–27509. [DOI] [PubMed] [Google Scholar]
- Saitoh M, Endo K, Furuya S, Minami M, Fukasawa A, Imamura T and Miyazawa K (2016) STAT3 integrates cooperative Ras and TGF‐β signals that induce Snail expression. Oncogene 35, 1049–1057. [DOI] [PubMed] [Google Scholar]
- Shipitsin M, Campbell LL, Argani P, Weremowicz S, Bloushtain‐Qimron N, Yao J, Nikolskaya T, Serebryiskaya T, Beroukhim R, Hu M et al (2007) Molecular definition of breast tumor heterogeneity. Cancer Cell 11, 259–273. [DOI] [PubMed] [Google Scholar]
- Siemens H, Jackstadt R, Hunten S, Kaller M, Menssen A, Gotz U and Hermeking H (2011) miR‐34 and SNAIL form a double‐negative feedback loop to regulate epithelial‐mesenchymal transitions. Cell Cycle 10, 4256–4271. [DOI] [PubMed] [Google Scholar]
- Smith AP, Verrecchia A, Faga G, Doni M, Perna D, Martinato F, Guccione E and Amati B (2009) A positive role for Myc in TGFβ‐induced Snail transcription and epithelial‐to‐mesenchymal transition. Oncogene 28, 422–430. [DOI] [PubMed] [Google Scholar]
- Taube JH, Herschkowitz JI, Komurov K, Zhou AY, Gupta S, Yang J, Hartwell K, Onder TT, Gupta PB, Evans KW et al (2010) Core epithelial‐to‐mesenchymal transition interactome gene‐expression signature is associated with claudin‐low and metaplastic breast cancer subtypes. Proc Natl Acad Sci U S A 107, 15449–15454. [DOI] [PMC free article] [PubMed] [Google Scholar]
- Thuault S, Tan E‐J, Peinado H, Cano A, Heldin C‐H and Moustakas A (2008) HMGA2 and Smads co‐regulate SNAIL1 expression during induction of epithelial‐to‐mesenchymal transition. J Biol Chem 283, 33437–33446. [DOI] [PMC free article] [PubMed] [Google Scholar]
- Vega S, Morales AV, Ocana OH, Valdes F, Fabregat I and Nieto MA (2004) Snail blocks the cell cycle and confers resistance to cell death. Genes Dev 18, 1131–1143. [DOI] [PMC free article] [PubMed] [Google Scholar]
- Vincent T, Neve EP, Johnson JR, Kukalev A, Rojo F, Albanell J, Pietras K, Virtanen I, Philipson L, Leopold PL et al (2009) A SNAIL1‐SMAD3/4 transcriptional repressor complex promotes TGF‐β mediated epithelial‐mesenchymal transition. Nat Cell Biol 11, 943–950. [DOI] [PMC free article] [PubMed] [Google Scholar]
- Vukicevic S and Grgurevic L (2009) BMP‐6 and mesenchymal stem cell differentiation. Cytokine Growth Factor Rev 20, 441–448. [DOI] [PubMed] [Google Scholar]
- Whiteman EL, Liu CJ, Fearon ER and Margolis B (2008) The transcription factor snail represses Crumbs3 expression and disrupts apico‐basal polarity complexes. Oncogene 27, 3875–3879. [DOI] [PMC free article] [PubMed] [Google Scholar]
- Wu Y, Evers BM and Zhou BP (2009) Small C‐terminal domain phosphatase enhances snail activity through dephosphorylation. J Biol Chem 284, 640–648. [DOI] [PMC free article] [PubMed] [Google Scholar]
- Yang S, Du J, Wang Z, Yuan W, Qiao Y, Zhang M, Zhang J, Gao S, Yin J, Sun B et al (2007) BMP‐6 promotes E‐cadherin expression through repressing δEF1 in breast cancer cells. BMC Cancer 7, 211. [DOI] [PMC free article] [PubMed] [Google Scholar]
- Ye X and Weinberg RA (2015) Epithelial‐mesenchymal plasticity: a central regulator of cancer progression. Trends Cell Biol 25, 675–686. [DOI] [PMC free article] [PubMed] [Google Scholar]
- Zhang Y, Liu T, Meyer CA, Eeckhoute J, Johnson DS, Bernstein BE, Nusbaum C, Myers RM, Brown M, Li W et al (2008) Model‐based analysis of ChIP‐Seq (MACS). Genome Biol 9, R137. [DOI] [PMC free article] [PubMed] [Google Scholar]
- Zhang K, Rodriguez‐Aznar E, Yabuta N, Owen RJ, Mingot JM, Nojima H, Nieto MA and Longmore GD (2012) Lats2 kinase potentiates Snail1 activity by promoting nuclear retention upon phosphorylation. EMBO J 31, 29–43. [DOI] [PMC free article] [PubMed] [Google Scholar]
- Zhou BP, Deng J, Xia W, Xu J, Li YM, Gunduz M and Hung MC (2004) Dual regulation of Snail by GSK‐3β‐mediated phosphorylation in control of epithelial‐mesenchymal transition. Nat Cell Biol 6, 931–940. [DOI] [PubMed] [Google Scholar]
Associated Data
This section collects any data citations, data availability statements, or supplementary materials included in this article.
Supplementary Materials
Table S1. An Excel file including primary data from the ChIP‐Seq analysis.This file tabulates in an organized manner the raw data deposited in Array Express under accession number E‐MTAB‐5242. The data are organized as: chromosome number, peak start, peak end, MACS, peak score, gene start, gene end, gene name, transcribed strand and distance from the gene start.
Table S2. An Excel file presenting the primary data from the AmpliSeq analysis.This file tabulates in an organized manner the raw data deposited in Array Express under accession number E‐MTAB‐5244. The data are organized as: Gene name, Target ID, ENTREZ_GENE_ID, normalized expression values in triplicate samples of the mock C3 clone (up_242_1, up_242_2, up_242_3) and the Snail1 KO CZ1 clone (up_242_7, up_242_8, up_242_9), mean of the mock C3 clone expression (meanCtrl), mean of the Snail1 KO CZ1 clone expression (mean Snail1), fold‐change in expression between Snail1 KO CS24 and control C3 cells (absMeanFC), p value (pval), adjusted p value (padj), differentially expressed gene (DEG) and coincidence with the ChIP‐Seq peaks (chipSeqPeak).
Data Availability Statement
All ChIP‐seq and AmpliSeq transcriptomic data have been deposited to Array Express under Accession Numbers E‐MTAB‐5242 and E‐MTAB‐5244, respectively.