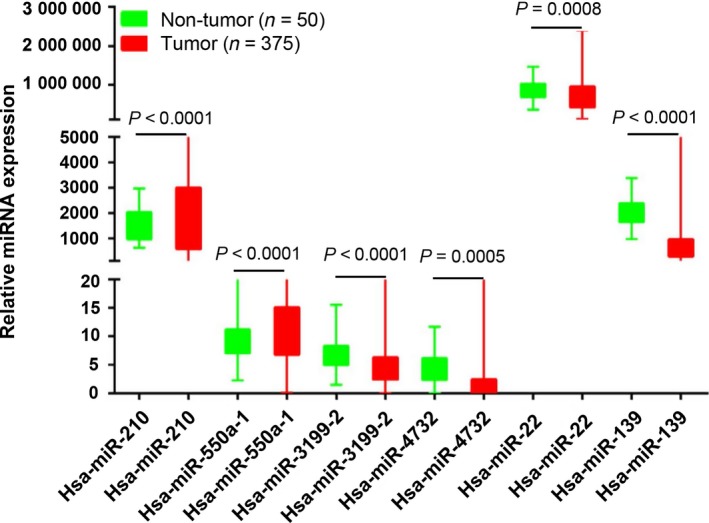
Figure 1.

Expression of the six prognostic miRNA in HCC tumor and nontumor tissues. Expression of the six miRNA identified by multivariable Cox regression analysis was determined in tumor and corresponding nontumor tissues. Differences between tumor and nontumor tissues were analyzed by two‐sided Student's t‐test to determine significance. P < 0.05 was considered statistically significant. The boxplot shows the range (lower and upper whisker), the first quartile (lower hinge), and the third quartile (upper hinge). The result was graphed by graphpad prism 6.0 (GraphPad Software, Inc., San Diego, CA, USA).
