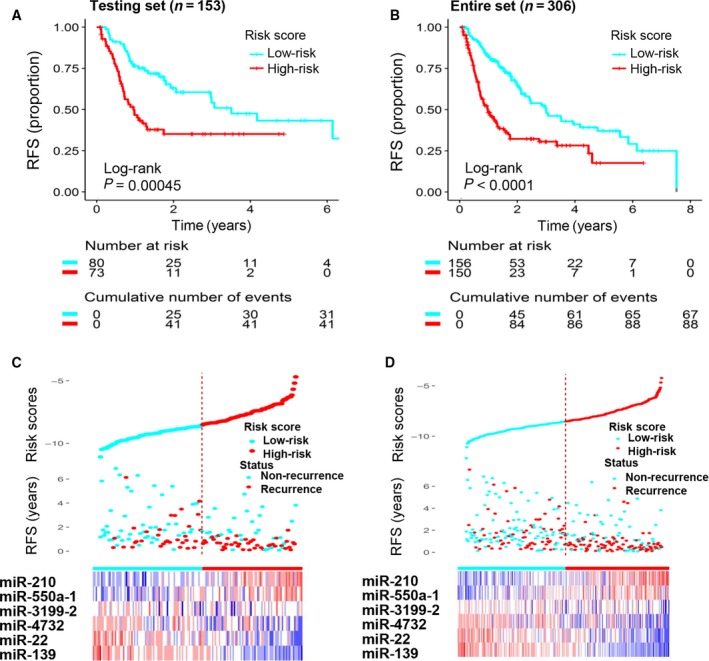
Figure 3.

Validation of the prognostic value of the six‐miRNA signature in the testing and entire TCGA sets. (A) The testing set was subjected to Kaplan–Meier analysis to compare RFS between patients in the high‐risk group and patients in the low‐risk group. (B) The entire set was subjected to Kaplan–Meier analysis to compare RFS between patients in the high‐risk group and patients in the low‐risk group. (C) The distribution of risk scores, RFS, and recurrence status and the prognostic miRNA expression patterns for the 153 patients in the testing set. (D) The distribution of risk scores, RFS, and recurrence status and the prognostic miRNA expression patterns for the 306 patients in the entire set. The risk scores are arranged in ascending order from left to right. The number below the curve represents the number of the patients in the high‐ and low‐risk group. The ‘+’ symbols in the panel indicate censored data.
