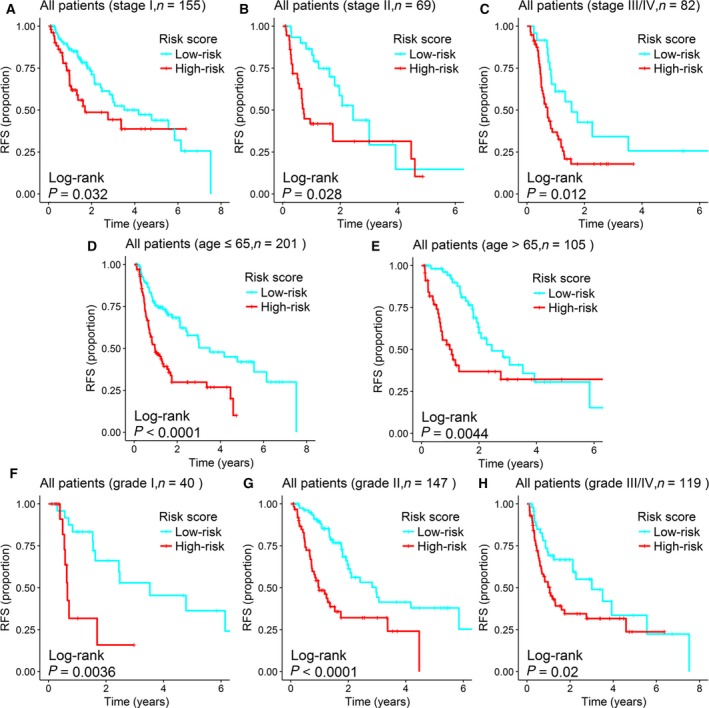
Figure 5.

Survival analysis of all HCC patients stratified by stage, age, and tumor grade. Survival analysis compared RFS by recurrence risk (high vs. low) stratified by clinical characteristics. (A) Kaplan–Meier curves for patients with stage I HCC (n = 155). (B) Kaplan–Meier curves for the patients with stage II HCC (n = 69). (C) Kaplan–Meier curves for patients with stage III/IV HCC (n = 82). (D) Kaplan–Meier curves for patients aged 65 years or younger (n = 201). (E) Kaplan–Meier curves for patients aged older than 65 years (n = 105). (F) Kaplan–Meier curves for patients with grade I tumor (n = 40). (G) Kaplan–Meier curves for patients with grade II tumor (n = 147). (H) Kaplan–Meier curves for patients with grade III/IV tumor (n = 119). The ‘+’ symbols in the panel indicate censored data.
