
Figure 6.
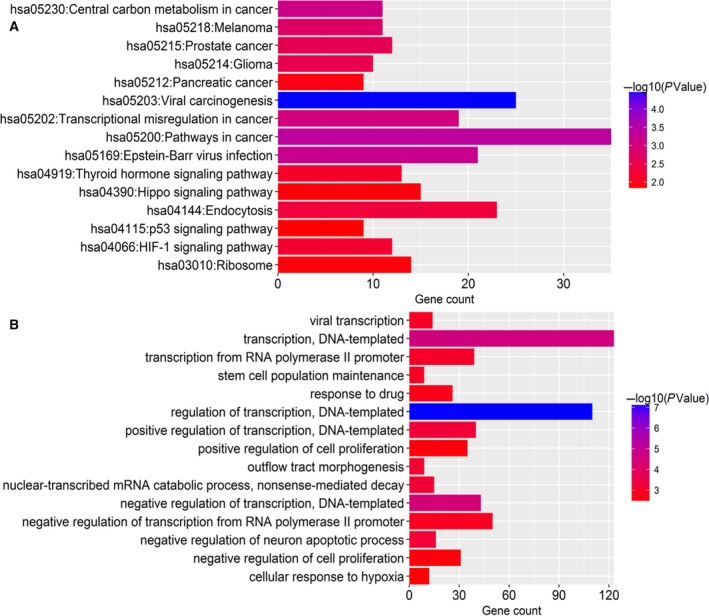
Functional enrichment analysis for predicted target genes of the six miRNA identified as independent predictors of HCC recurrence risk. (A) KEGG enrichment analysis. (B) GO enrichment analysis. The x‐axis represents the number of genes, and the y‐axis represents the GO terms and KEGG pathway names. The color indicates the P‐value.