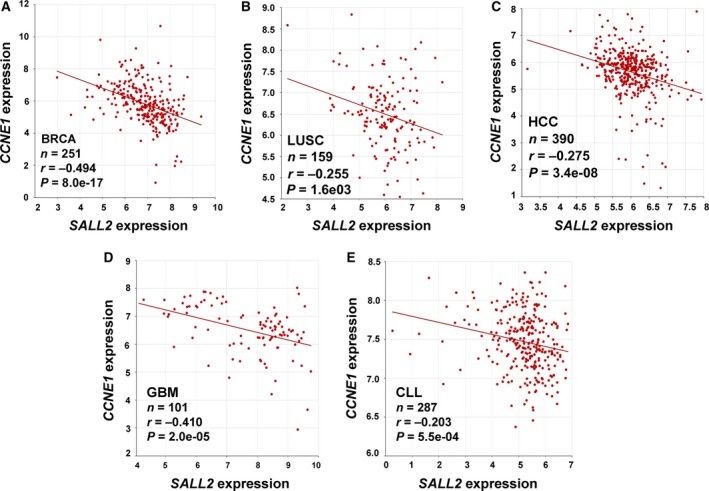
Figure 6.

Correlation between SALL2 and CCND1/CCNE1 expression in cancer. Scatter plots of SALL2 by CCND1 and CCNE1 were generated using publicly available databases and software's from R2: Genomics Analysis and Visualization Platform (http://r2.amc.nl). Pearson's correlation coefficients (r) and associated P values (p) were calculated using default HugoOnce algorithm and ANOVA statistical test. (A) BRCA, breast invasive carcinoma. (B) LUSC, lung squamous cell carcinoma, and (C) HCC, human colorectal cancer. (D) GBM, glioblastoma multiforme, (E) CLL, chronic lymphocytic leukemia, n = number of samples.
