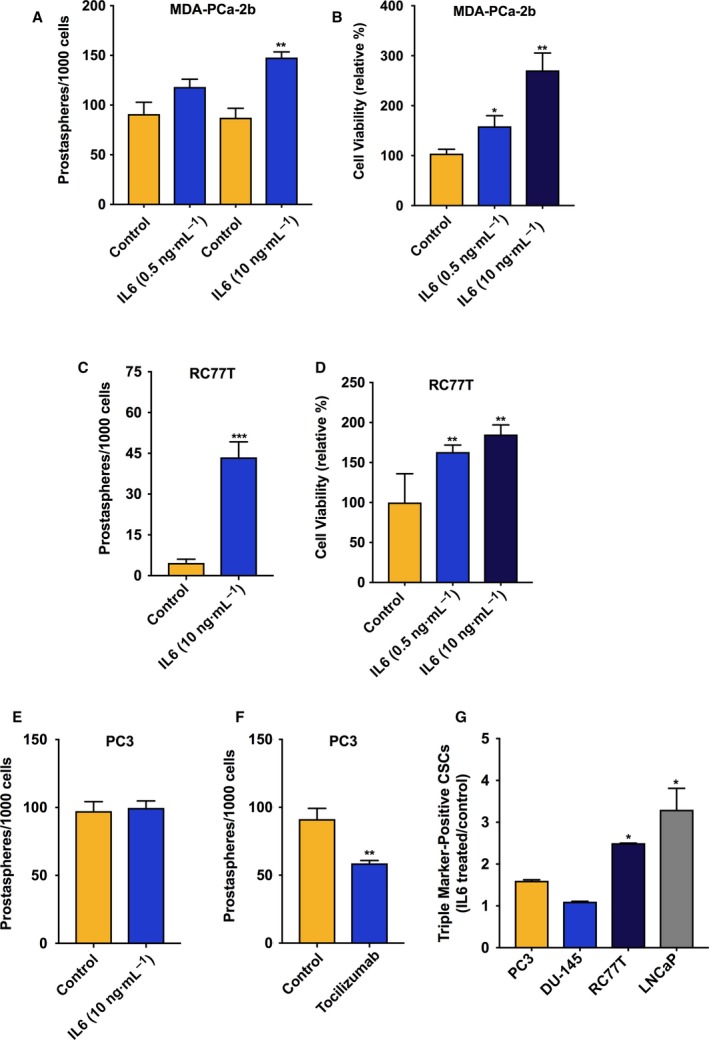
Figure 2.

IL‐6 treatment induced prostasphere formation in IL‐6 nonexpressing PCa cell line cultures. (A) Effect of IL‐6 treatment relative to vehicle control on the numbers of prostaspheres in 7‐day cultures of MDA‐PCa‐2b cells. (B) Effect of IL‐6 treatment (72‐h) on viability of MDA‐PCa‐2b cells, run in triplicate and repeated twice. (C) Effect of IL‐6 treatment relative to vehicle control on the numbers of prostaspheres in 7‐day cultures of RC77T cells. (D) Effect of IL‐6 on viability of RC77T cells, 7‐day treatment run in triplicate and repeated twice. (E) Effect of 7‐day IL‐6 treatment on the numbers of PC3 prostaspheres. (F) Effect of IL‐6 receptor inhibitor tocilizumab (10 μm, 7 days) on prostaspheres in PC3 cultures. (G) Impact of IL‐6 treatment on the percentage of CSCs in other cell lines in our panel measured by FACS analysis. Cells were treated with IL‐6 at 10 ng·mL−1 for 7 or 14 days for RC77T. The fraction of CSCs relative to total cell count was measured based on CSC triple‐marker‐positive status (CD44+/CD133+/EpCAM+). The results are presented as fold‐change, IL‐6 treated vs. control. Prostasphere assay and FACS data are representative of repeated experiments and are the average of three independent biological replicates. *P ≤ 0.05, **P ≤ 0.01.
