Figure 4.

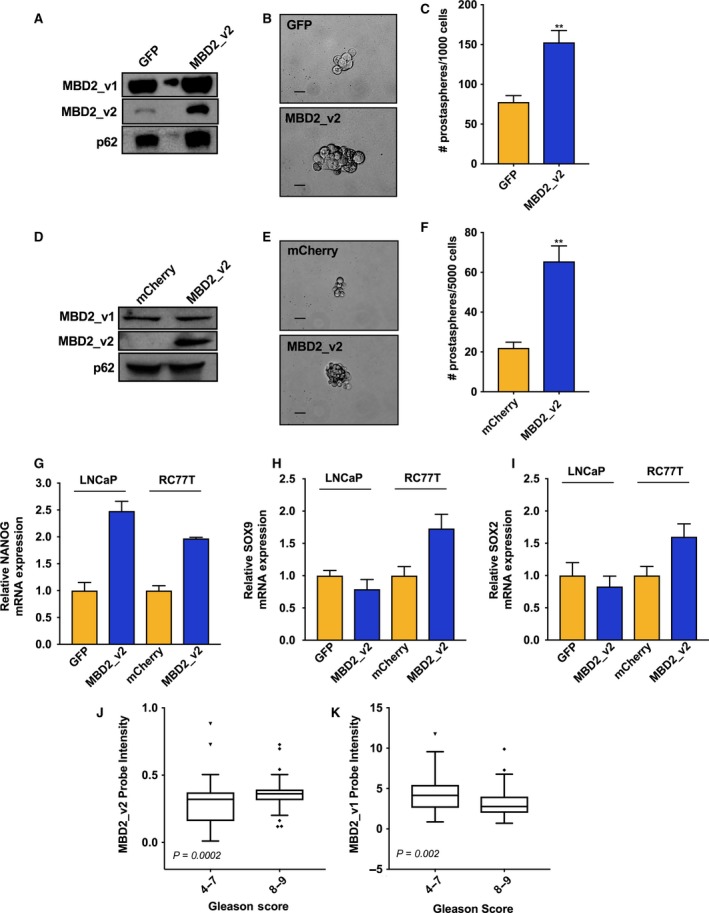
MBD2_v2 overexpression enhances prostasphere formation and is associated with high‐grade PCa. (A) Immunoblot measure of MBD2 isoforms in LNCaP cell line stably transduced with MBD2_v2 or GFP control expression vectors. (B,C) The effect of stable MBD2_v2 overexpression in LNCaP cells on prostasphere size and prostasphere numbers relative to GFP‐expressing LNCaP control cells. Bar = 1000 μm. (D) Immunoblot measure of MBD2 isoforms in RC77T cell line stably transduced with MBD2_v2 or mCherry control expression vectors. (E,F) The effect of stable MBD2_v2 overexpression in RC77T cells on prostasphere size and prostasphere numbers relative to mCherry‐expressing RC77T control cells. Three biological replicates were used in each prostasphere assay, which was performed twice (total of six biological replicates). Bar = 1000 μm. (G–I) Real‐time RT–PCR analysis was performed to measure the effect of MBD2_v2 stable overexpression on NANOG, SOX9, and SOX2 levels in LNCaP and RC77T cells. (J,K) PCa data sets compiled from Oncomine [GS 4‐7 (n = 171) and GS 8‐9 (n = 53)] were used to test if high MBD2_v2 or MBD2_v1 transcript expression associated with high GS. **P ≤ 0.01.
