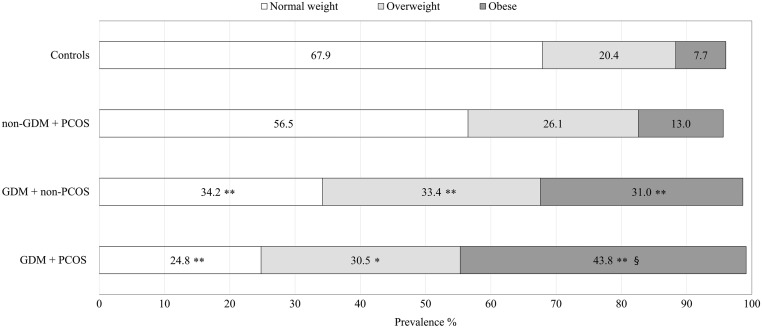
Figure 3.
Prevalence of normal weight, overweight and obese women in the subgroups. P values for difference between each subgroup and the control group: *<0.05; **<0.001. P value for difference between GDM + PCOS group and GDM + non-PCOS group: §0.009. Normal weight BMI: 18.5–24.9 kg/m2, overweight BMI: 25.0–29.9 kg/m2 and obese BMI: ≥30.0 kg/m2.

 This work is licensed under a