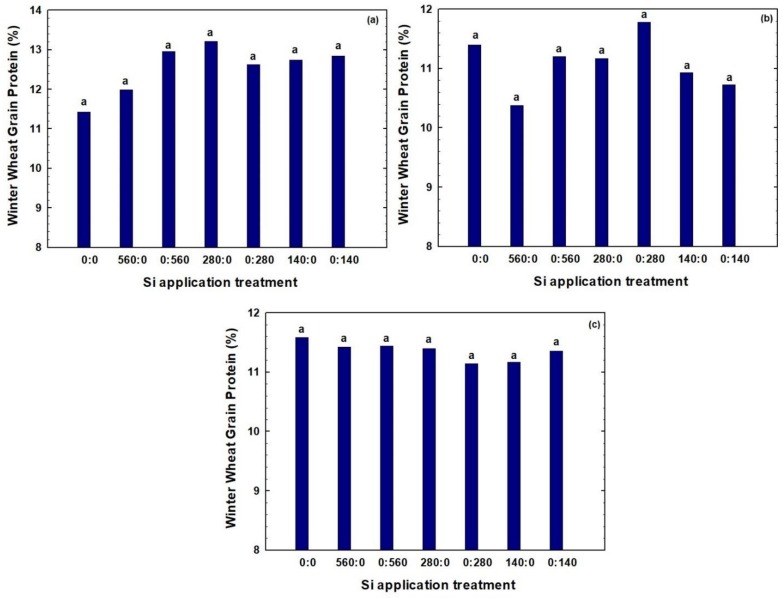
Figure 4.
Effect of different Si rates and application time on winter wheat grain protein in (a) Field E1 in 2016, (b) Field M2 in 2016, and (c) Field A3 in 2017. Treatments are designated in the format x:y, in which x and y are the fertilizer Si rates in kg Si ha−1 applied at planting and at tillering, respectively. Bars within the same year followed by the same letter are not significantly different (p > 0.1) based on a Duncan’s multiple range test.

