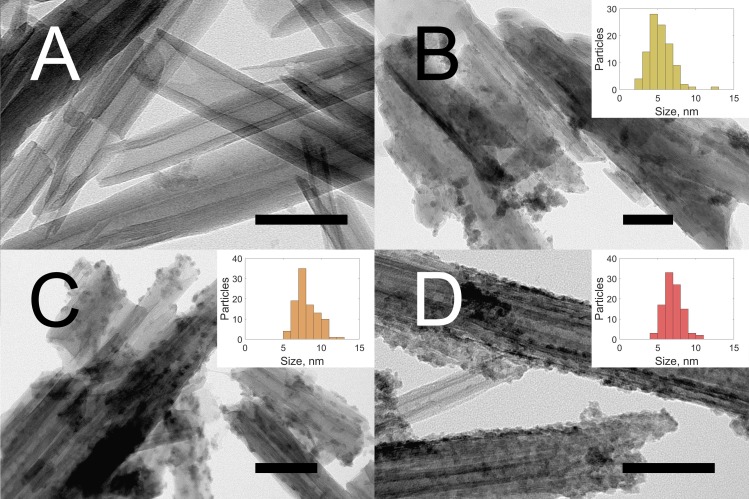
Figure 1.
TEM images of pristine HNT (A); HNT-NH2-CdS (B); HNT-Azine-CdS (C); and HNT-Azine- Cd0.7Zn0.3S (D). Particle size distributions derived from measurements of 100 particles for each sample are shown in insets (B–D), (see also Table S1 in Supplementary Materials).

