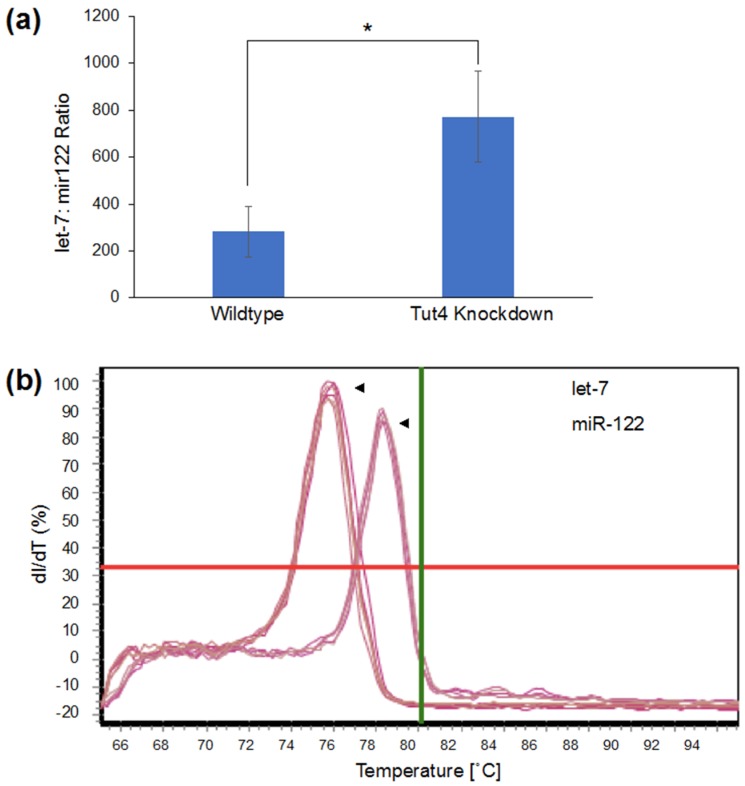
Figure 4.
qPCR for let-7 miRNA in wildtype and Tut4-knockdown HEK293 cells. Cells were grown to confluence and total RNA was extracted. (a) Let-7 levels were quantified in relation to miRNA miR-122. miRNA levels in the wildtype and Tut4 knockdown are significantly different (p < 0.03). Error bars are based on three biological replicates and show one standard deviation. (b) Melting curves of let-7 and miR-122 primers are distinct and specific. p values are * < 0.05.

