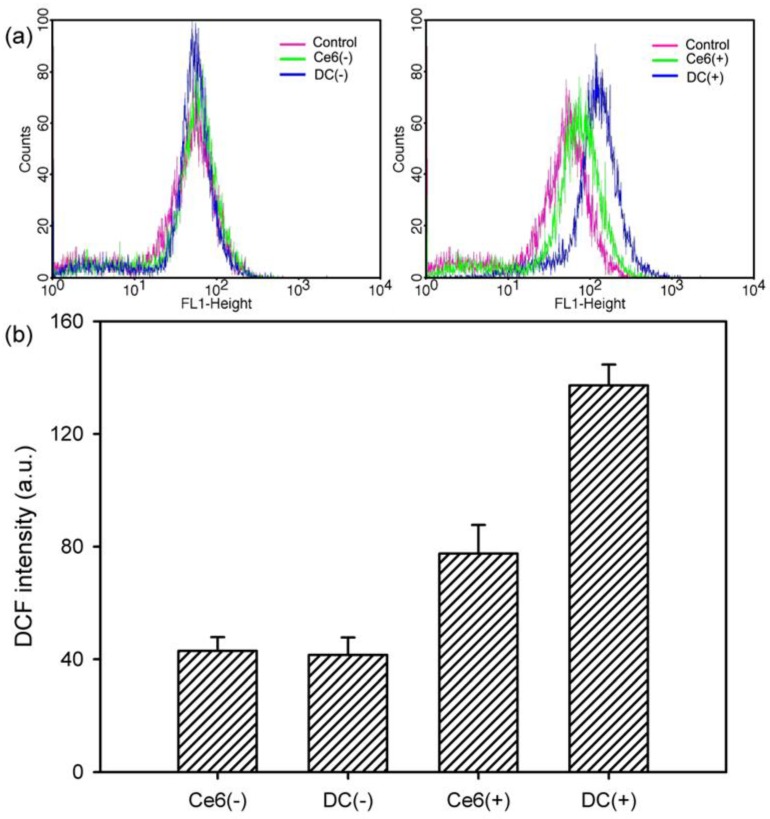
Figure 9.
Flow cytometric analysis of ROS generation in HeLa cells treated with free Ce6 and DC (4 μg/mL Ce6). (a) Shift in fluorescence peak due to the ROS generation in the presence of free Ce6 and DC before irradiation (Ce6(−) and DC(−)) and after irradiation (Ce6(+) and DC(+)) with a 2.5-J/cm2, 671-nm diode laser. (b) DCF fluorescence intensity measured with the flow cytometer for investigating the ROS level with free Ce6 and DC before and after irradiation (n = 5).

