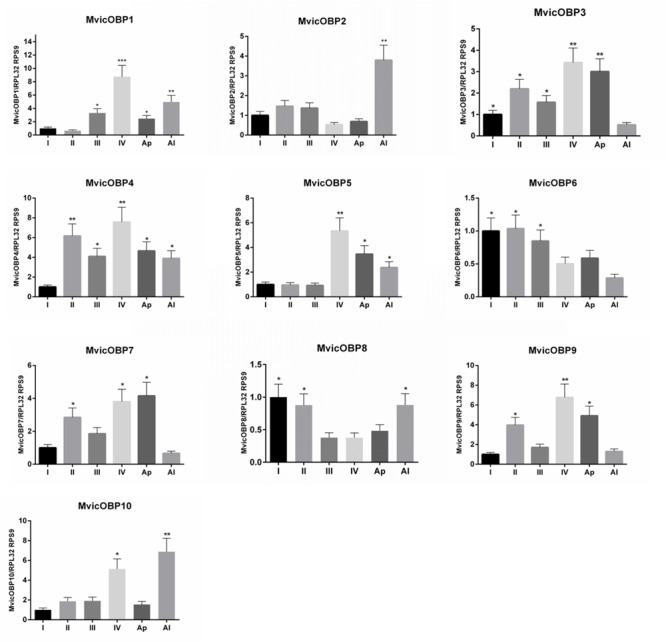
FIGURE 5.

Relative expression level of M. viciae OBPs in different nymphal instars. OBP expression levels were quantified by RT-qPCR. Bars represent the standard deviation of the mean for 3 independent experiments. Significant differences are denoted by asterisks (Tukey’s test, (∗p < 0.05, ∗∗p < 0.01, ∗∗∗p < 0.001)). I, 1st nymphal instar; II, 2nd nymphal instar; III, 3rd nymphal instar; IV, 4th nymphal instar; Ap, winged adults; Al, winged adults. Reference genes: RPL32, RPS9. Calibrator sample: 1st nymphal instar
