Figure 3.
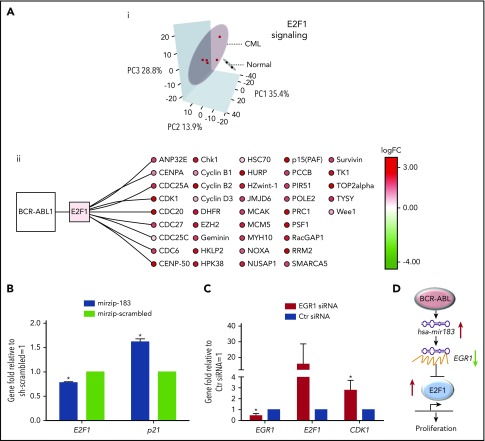
CML SPCs show deregulation of E2F1-signaling networks. (Ai) Analysis of mRNA screen for CD34+PY−Ho− healthy (N = 2 biological replicates) and CML (N = 5 biological replicates) cells. PCA reduced the high-dimensional data set to 3 dimensions using E2F1 targets as obtained from MetaCoreKB (targets listed in supplemental Table 3). Each sample is represented as a dot; CML and healthy samples are colored red and black, respectively. Three-dimensional (3D) ellipses are drawn around each set of samples (CML or healthy) using the mean and covariance of that set, to represent each sample type’s 95% confidence region. Axes labels indicate the percentage of variability accounted for by each principal component (PC). (ii) The network of BCR-ABL1, E2F1, and E2F1 targets, significantly deregulated in CML is shown. Node color indicates transcriptional deregulation in CML vs healthy G0 cells (ArrayExpress accession E-MTAB-2508), with red/green indicating up/downregulation, respectively; color intensity indicates the extent of the deregulation (as indicated by the color bar). (B) Levels of E2F1 and p21 mRNA measured by Q-PCR in hsa-mir183 knockdown CML SPCs. (C) Levels of EGR1, E2F1, and CDK1 mRNA measured by Q-PCR after knocking down EGR1 by siRNA in CML SPCs. (D) Schematic summary of the hsa-mir183/EGR1–mediated regulation of E2F1 (each experiment had N = 3 biological replicates;*P < .05). Ctr, control; logFC, log fold change.

