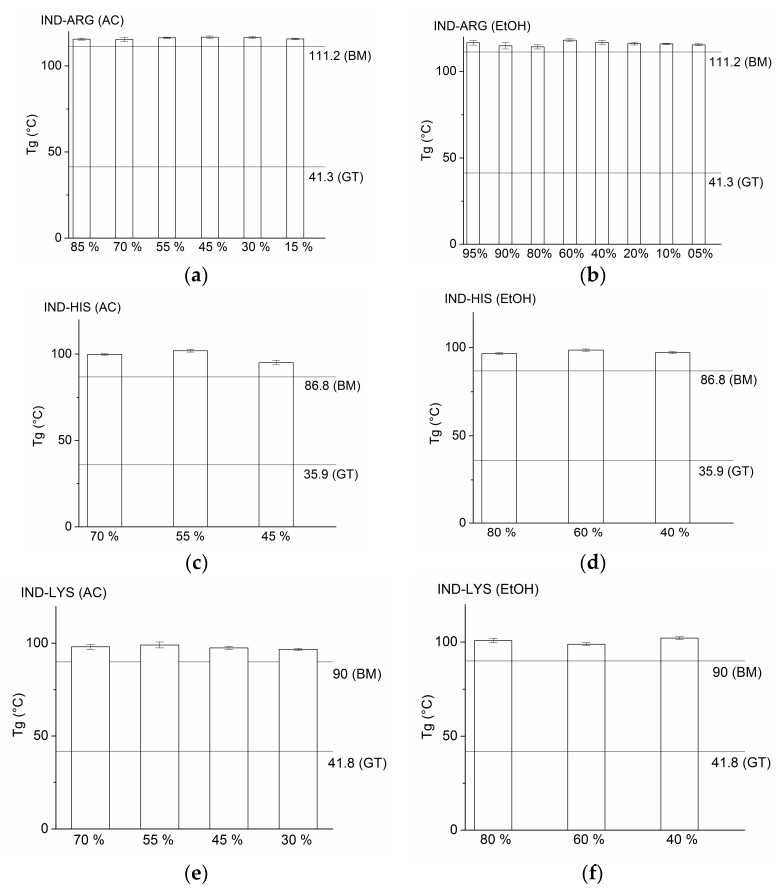
Figure 3.
Glass transition temperature (Tg) of indomethacin–arginine (IND–ARG), IND–histidine (IND–HIS), and IND–lysine (IND–LYS) prepared by different preparation methods. The horizontal lines in each graph indicate the Tg measured from ball-milled (BM) samples and theoretical Tg calculated using the Gordon–Taylor equation (GT), respectively. Vertical bars represent Tg values of spray-dried co-amorphous samples where the organic solvent denoted in percentage (%) is acetone (AC) in (a,c,e); and ethanol (EtOH) in (b,d,f).

