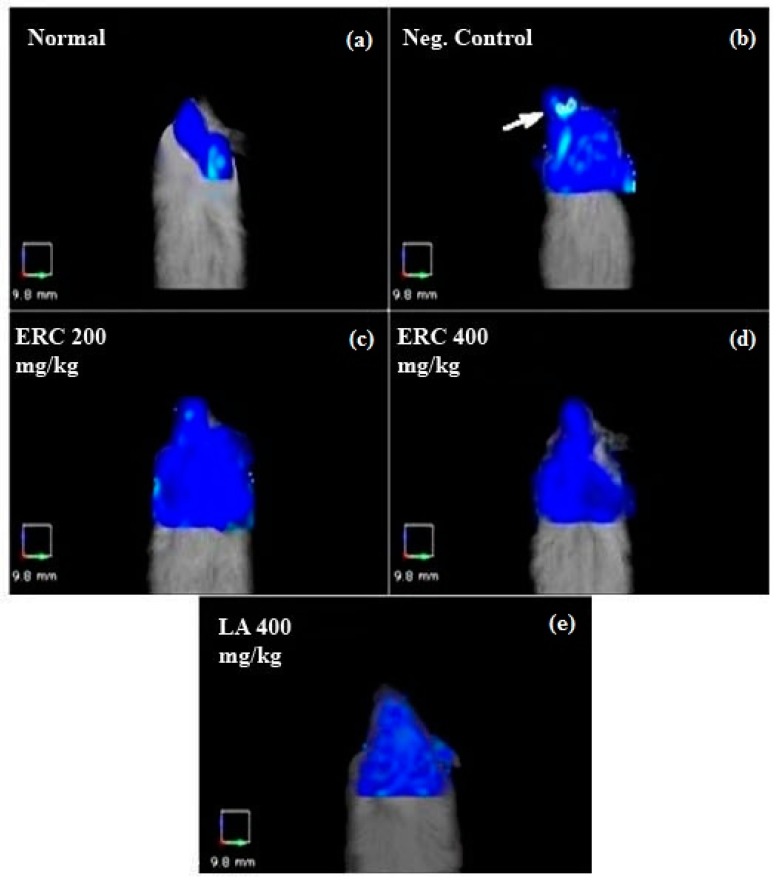
Figure 2.
Fluorescence molecular tomography images without the region of interest (ROI). In this figure, the ROI area was not selected, but the differences in fluorescence intensities between the negative control (b) and the treated groups (c–e) is obvious. The negative control was the animal with induced ischemia at the left optic nerve/eye. The untreated normal animal was used as the positive/normal control (a). ProSens 750 was used as the inflammatory (cathepsin) fluorescent probe. In the group treated with 400 mg/kg body weight of ERC (d) and LA (e), the cathepsin fluorescence signal was significantly lower than that of the negative control.

