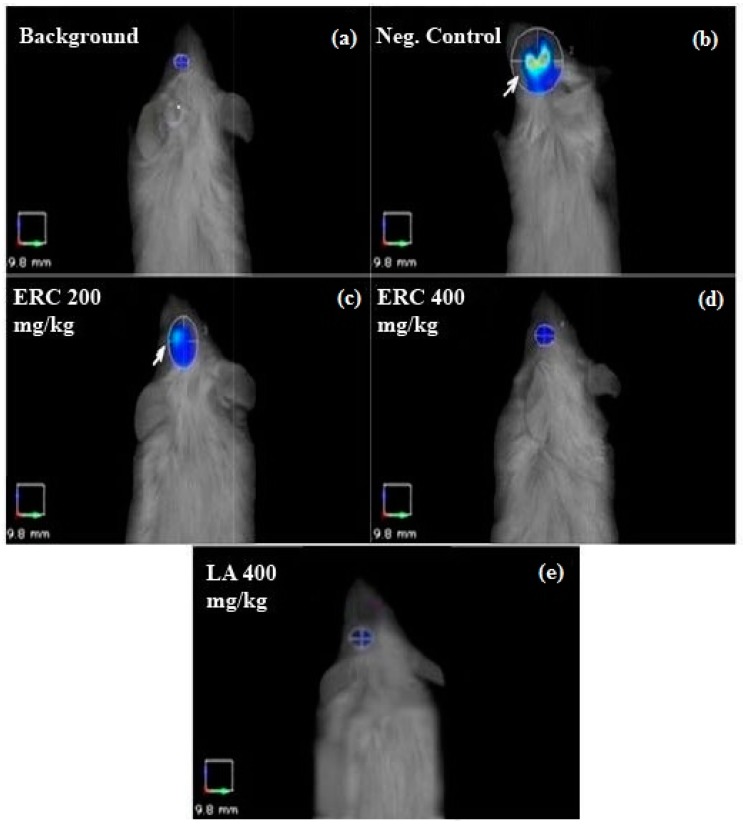
Figure 3.
Fluorescence molecular tomography images with the region of interest (ROI). The ROI proximal to the eye area was selected to focus on the ischemic eye. In the negative control (b), the fluorescence signal was very intense (white arrow), whereas, in the treated ischemic eyes, treatment with LA (e) and different concentrations of ERC (c,d) reduced the fluorescence signal of the ROI. The image of the normal/positive control was used as the background.

