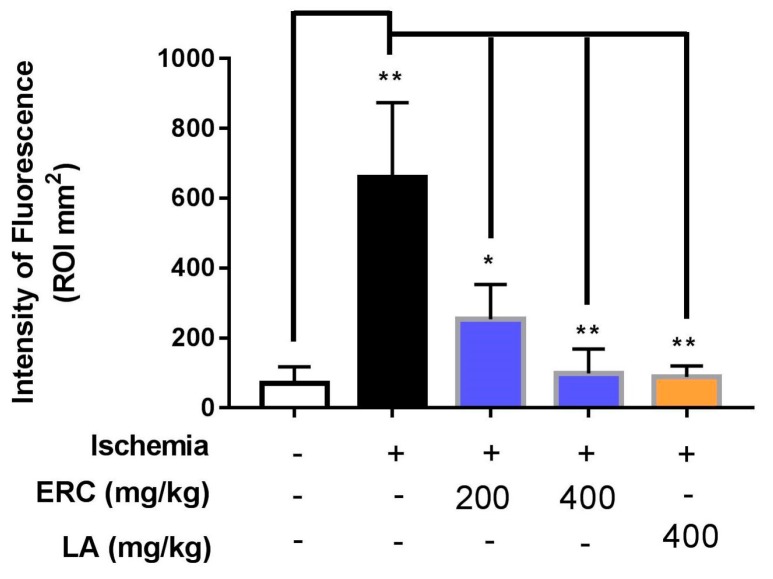
Figure 4.
Graphical representation of the intensity of the fluorescence signal generated after induction of ischemia. Animals treated with ERC and LA exhibited a significant reduction in the ischemia-induced signal compared to the untreated group (control). Data are expressed as mean ± SEM (n = 3), * p-value < 0.05, ** p-value < 0.01.

