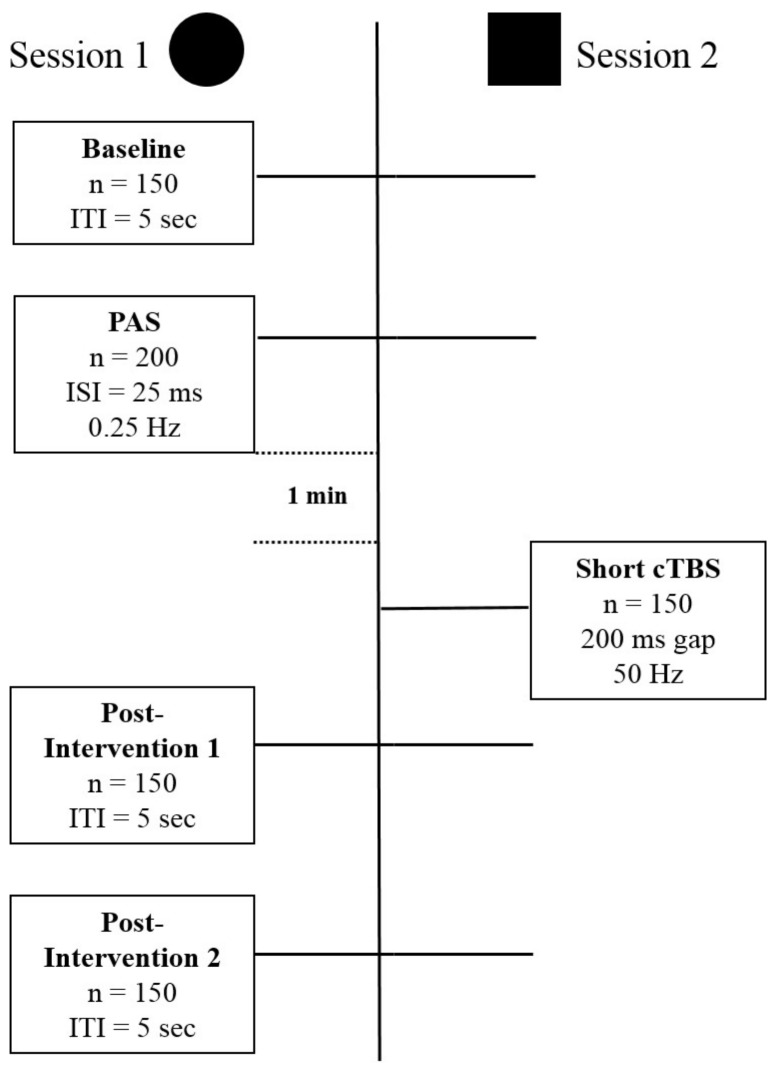
Figure 1.
The figure schematically depicts the structure of the experiments with the different stimulation and recording components of Session 1, Long Term Potentiation (LTP)-induction, and Session 2, depotentiation-induction. Session 1 and 2 express different types of stimulation protocols, and do not reflect the order in time. Abbreviations: n = number, ITI = Intertrial interval, ISI = Interstimulus interval, Hz = Hertz, PAS = Paired Associative Stimulation, cTBS = continuous Thetaburst Stimulation.

