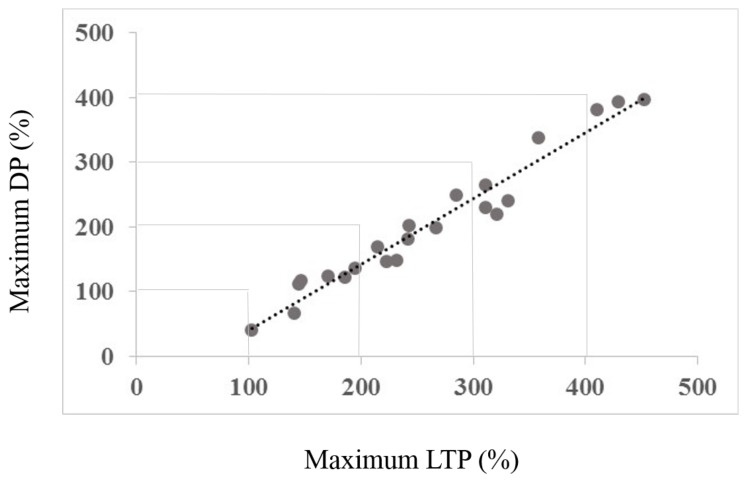
Figure 3.
The figure shows the correlation between the maximum LTP amount and maximum change (depotentiation) amount. Note that none of the subjects shows a change towards increased LTP, all show a reduction towards baseline. Figure 4 depicts the rationale for the depotentiation quantification. The x-axis data derive from Session type 1, the y-axis data from both Session types as depicted in Figure 4.

