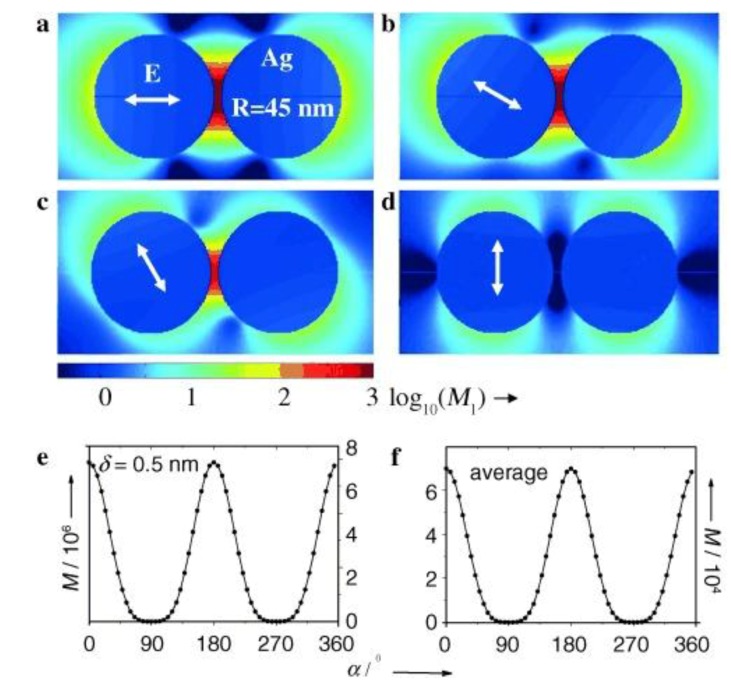
Figure 9.
Local intensity enhancement in a logarithmic scale in a plane through the centers of the Ag spheres and perpendicular to the incident wavevector versus incident polarization: (a) 0°; (b) 30°; (c) 60° and (d) 90°. The incident wavelength was 514.5 nm in all cases. The arrows represent the different polarizations. In (e), the SERS enhancement factor is shown as a function of the incident polarization for a point in the nanogap located at the dimer axis nm away from one spherical surface, and the fit (solid line) to a dependence. In (f), averaged over all points nm outside the Ag sphere surface versus and fit to a dependency are shown. The radius nm corresponds to the average size of the Ag nanoparticles used in the experiment while the separation distance nm corresponds to the diameter of a hemoglobin molecule. Reprinted with permission from [54].

