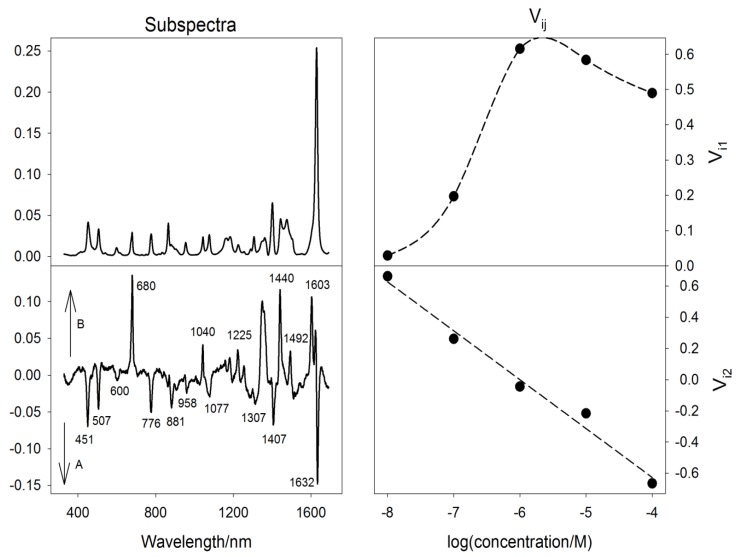
Figure 11.
Results of factor analysis of concentration-dependent SERS measurements of methylene blue (MB). Profile of the Vi1 coefficients reflects the variation in MB SERS intensity with concentration. Profile of the Vi2 coefficients and the shape of the second subspectrum reveal a systematic decrease in the ratio of EFs for B/A modes with increasing concentration (cf. Figure 10).

