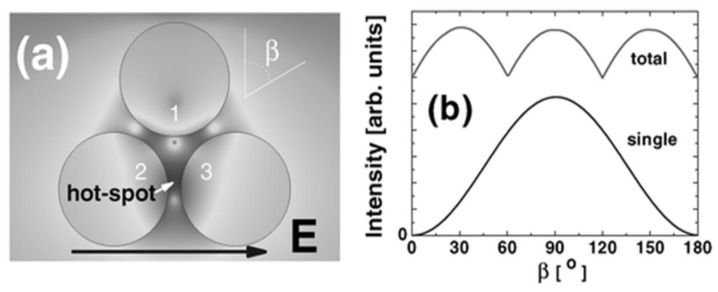
Figure 12.
A simple example of a cluster with quasi-isotropy. In this case an example of a 2D cluster formed by three cylinders (radii = 25 nm) with a small separation gap ( = 6.7 nm) is shown. The problem is solved in the electrostatic approximation, wavelength = 357 nm. The polarization is changed in the plane for different angles as shown in (a) where the electromagnetic intensity (on a logarithmic grey-scale) is explicitly shown for the case . A hot-spot in between cylinders 2 and 3 can be easily seen. If we look at the maximum enhancement at any point on the surface of the cluster, there will always be a place that profits the most from the particular orientation of the field and we obtain the curve labelled as ‘‘total’’ in (b). The three maxima in the latter are the three possible two-cylinder hot-spots in this cluster that achieve their highest value when the field is aligned along the axis joining any two of them. If the surfaces were uniformly covered with analyte, an almost isotropic response is obtained. The degree of isotropy increases with the complexity of the cluster. However, if the enhancement at one specific point is monitored (in this case the enhancement in the gap in between 2 and 3) we obtain the curve labelled as ‘‘single’’ in (b) which shows the full anisotropy of any single hot-spot. Adapted from [40] with permission from The Royal Society of Chemistry.

