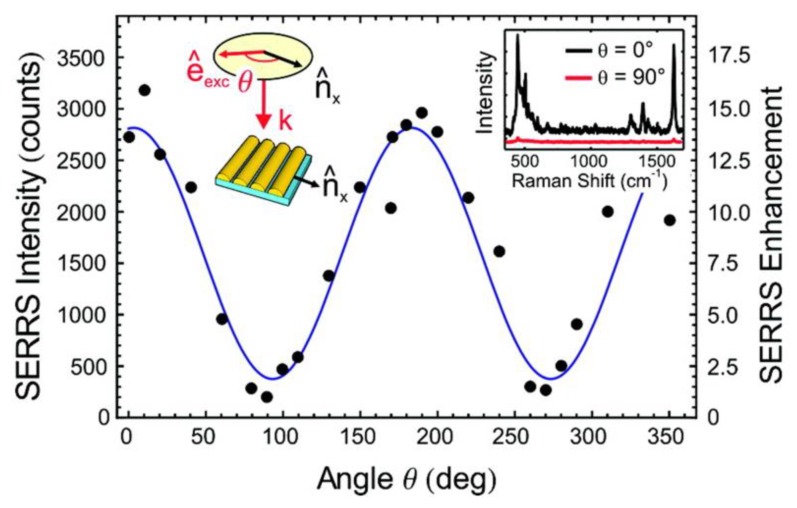
Figure 13.
Unpolarized SERS intensity of methylene blue adsorbed on gold nanowires (NWs) versus excitation polarization as measured in a backscattering geometry. SERS intensity was found maximum for (inset, black line), i.e., for incident polarization vector (denoted as ) parallel to the nanocavity axis , and minimum for (inset, red line), i.e., parallel to the NWs long axis . The SERS intensity profile was well fitted with the law (blue line), plus low order terms (Equation (63)). Excitation wavelength was 633 nm, thus the SERS spectrum is considered as a resonance one (SERRS). Adapted with permission from [43]. Copyright 2011 American Chemical Society.

