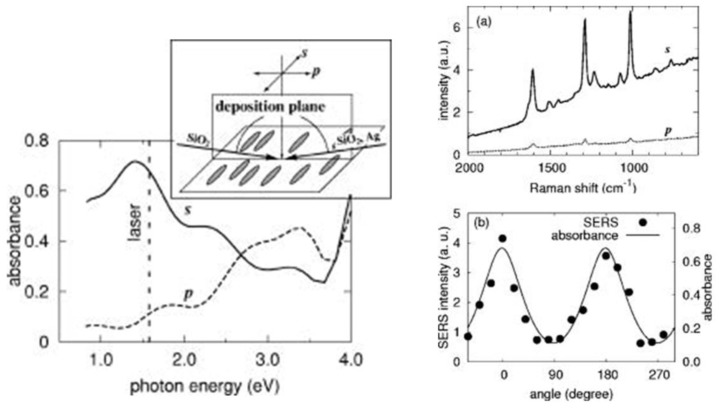
Figure 19.
Left: The absorbance spectra of the Ag NR arrays tuned to the Raman spectroscopy at excitation wavelength of 785 nm (1.58 eV). The incident light was either p or s polarized, where an electric field vibrates parallel or perpendicular to the deposition plane, respectively, as shown schematically in the upper right box. Right: Polarization dependence of the Raman spectra (a) and the peak intensity at 1014 cm−1 (b). The polarization dependence of the absorbance at the wavelength of 785 nm is also shown (b). Adapted with permission from [98].

