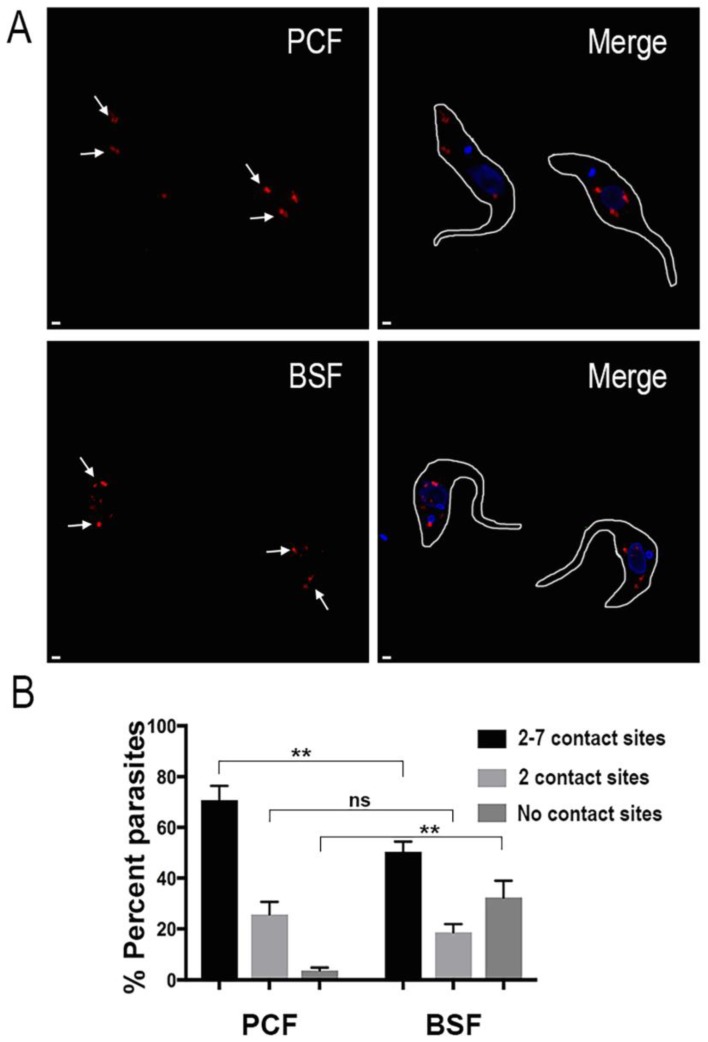
Figure 3.
(A) Representative super resolution structured illumination images of T. brucei PCF and BSF trypanosomes subjected to proximity ligation assay. The red fluorescent signals indicated by the white arrows confirm the existence of membrane contact sites between acidocalcisomes and the mitochondrion in these parasites. Only some of them are labeled with arrows. DAPI staining is in blue. Merge images are at right. Scale bars = 1 µm; (B) Quantification of the number of contact sites observed using the proximity ligation assay. A total of one hundred PCF or one hundred BSF parasites were counted in each of three independent biological experiments (n = 3) and classified according to the number of contact sites observed in them. Values shown are means ± s.d. of n = 3. ** p < 0.05, Student’s t test; ns is no significant difference.

