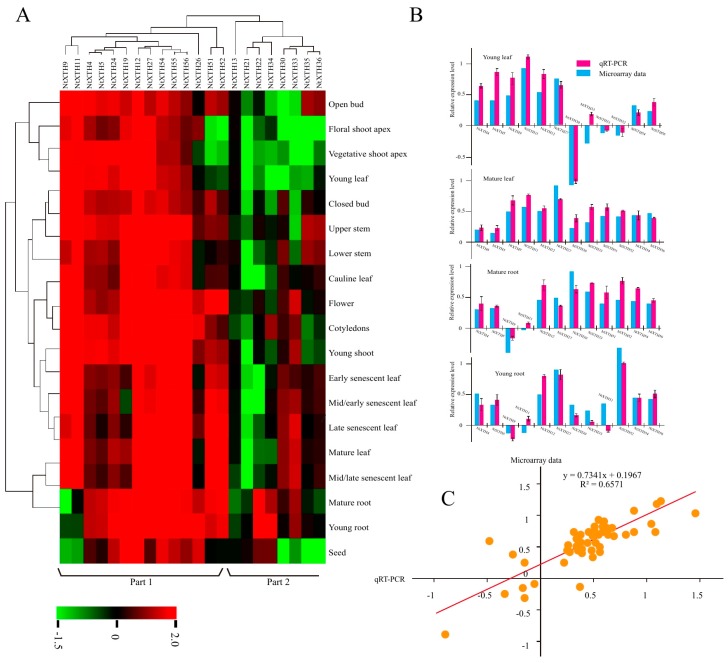
Figure 7.
Microarray and RT-PCR analysis of NtXTHs in different tissues. (A) Hierarchical cluster analysis of NtXTH gene expression in different tissues. The expression data were collected through the public RNA-seq database TobEA. The mean expression value of each gene was log2 transformed to create the hierarchical map. Each column represents the transcriptional units of XTH genes. The rows represent the different tobacco tissues. Green represents the lowest expression and red represents the highest expression. (B) Comparison of changes in the abundance and expression levels of selected NtXTH genes. (C) Coefficient analysis between gene expression ratios obtained from TobEA and qRT-PCR data.

