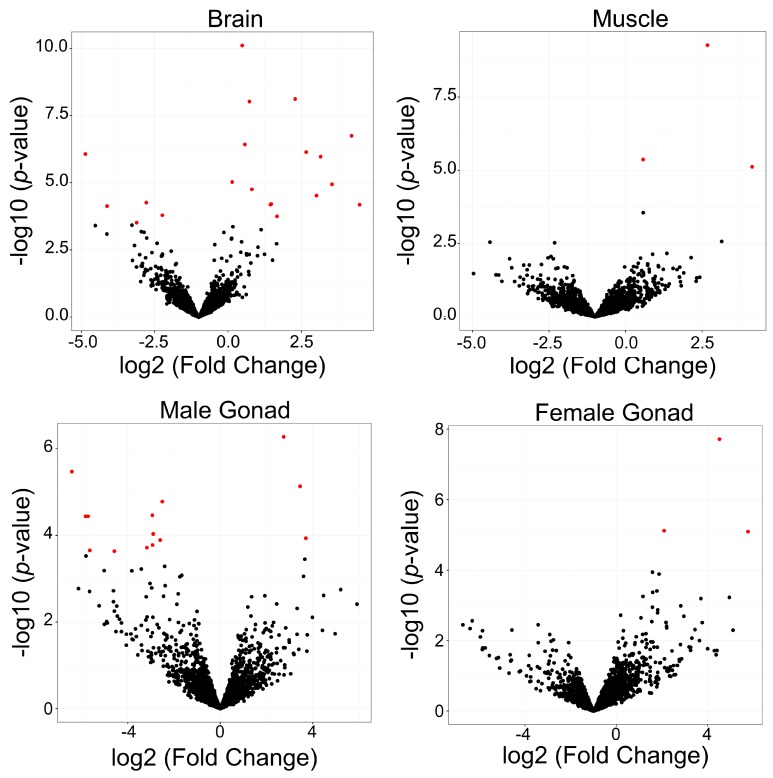
Figure 3.
Volcano plots showing differential expression between B- and B+ individuals in brain, muscle, and male and female gonads. Red points indicate elements with differential expression above the threshold (log2 fold-change 1.2 and false discovery rate (FDR) <5%). Upregulated repeats in the B+ genomes are represented on the right side, and downregulated repeats in the B+ genomes are represented on the left side of each figure.

