Figure 6.
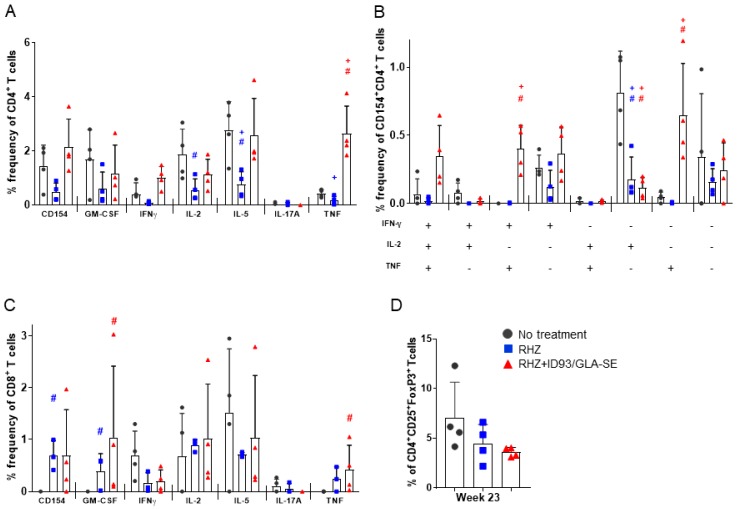
Increased ID93-specific cytokine responses from CD4+ and CD8+ T cells in the lung following immunotherapy. Pulmonary T cell responses assessed 23 weeks after Mtb infection. (A) The percent of single-cytokine producing CD4+ T cells; (B) the percent of polyfunctional CD4+ T cells producing one or more cytokines; and (C) the percent of single-cytokine producing CD8+ T cells, examined by intracellular flow cytometry after ex vivo stimulation with ID93 antigen. Data are representative of two individual experiments. Groups were compared by Student’s t-test and the Wilcoxon rank test, and significance is denoted by # and +, respectively. (D) The percent of regulatory T cells, CD4+FoxP3+CD25+ 23 weeks post infection from untreated (dark grey, circles), RHZ (blue, squares), or RHZ+ID93/GLA-SE (red, triangles) treated mice. Comparisons between groups performed using one-way ANOVA with Sidak’s multiple comparison test were all found to be not significant (n.s.).

