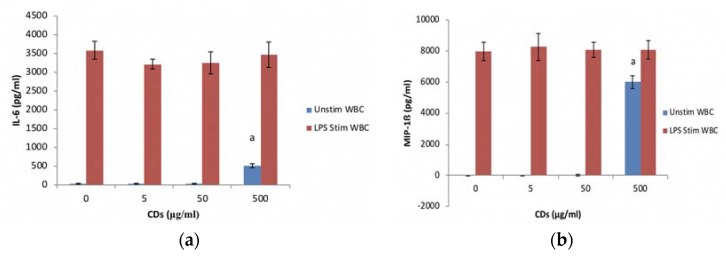
Figure 5.
The inflammatory biomarker expression levels of whole blood cell cultures exposed to CDs. Nanoparticles (NPs) in the absence or presence of LPS: (a) IL-6 expression levels and (b) MIP-1β expression levels. Data represents mean ± SD with n = 4. Bars marked with letters indicate significant differences (p < 0.01). Significance demarcated by: a—significantly different compared (p < 0.002) to 0 μg/mL CD control.

