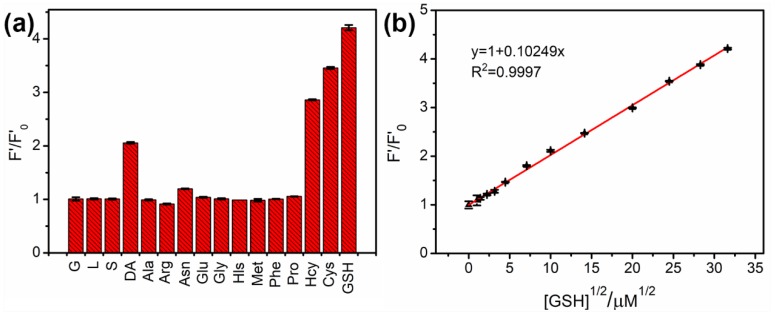
Figure 6.
(a) Selectivity of N-CNPs/Fe(III) to different biological molecules at the same concentration (1 mM); (b) The linear relationship between (F’/F’0) and the square root of glutathione (GSH) concentration. F’ and F’0 were the PL intensities (424 nm) of N-CNPs/Fe(III) at 340 nm excitation in the absence and presence of biological molecules, respectively.

